
【Python例項第18講】affinity propagation聚類演算法
機器學習訓練營——機器學習愛好者的自由交流空間(qq 群號:696721295)
在統計和資料探勘裡,affinity propagation(AP)是一種基於資料點之間的“資訊傳遞”的聚類演算法。與k-means等其它聚類演算法不同的是,AP不需要在聚類前確定或估計類的個數。類似於k-medoids, AP需要尋找原型(exemplars), 即,代表類的輸入集裡的成員。AP演算法廣泛應用於計算機視覺和計算生物學領域。
演算法描述
設
組成資料點集合,這裡並不需要假設資料集的結構。令
是一個量化任何兩點相似度的函式。對任意
,
, 當且僅當
與
更相似。在這裡,使用負平方距離,即,
令相似矩陣
, 它的對角元
尤其重要,因為它代表了輸入偏好。這意味著一個輸入在多大程度上可能是一個exemplar. 特別地,當所有對角元都相同時,它實際上控制了演算法產生多少個類。該值越大,產生的類就越多。AP演算法在兩個資訊傳遞步迭代,升級兩個測度。
-
responsibility矩陣 , 矩陣元素 量化 作為 的exemplar的適配程度。 -
availability矩陣 , 矩陣元素 表示 選擇 作為它的exemplar的適合程度。
, 初始化為零矩陣。然後,演算法在下面的兩步間迭代升級:
- 首先升級 :
- 然後升級 :
迭代進行到達到類的邊界,或者預定的迭代次數,演算法停止。對於滿足 的資料點,作為類的exemplars.
Python 例項
scikit-learn的方法 AffinityPropagation 實現AP聚類。下面,我們使用方法make_blobs
模擬300個樣本、3箇中心的isotropic高斯資料團,在這些模擬資料上進行聚類,比較聚類效果。
from sklearn.cluster import AffinityPropagation
from sklearn import metrics
from sklearn.datasets.samples_generator import make_blobs
# #############################################################################
# Generate sample data
centers = [[1, 1], [-1, -1], [1, -1]]
X, labels_true = make_blobs(n_samples=300, centers=centers, cluster_std=0.5,
random_state=0)
# #############################################################################
# Compute Affinity Propagation
af = AffinityPropagation(preference=-50).fit(X)
cluster_centers_indices = af.cluster_centers_indices_
labels = af.labels_
n_clusters_ = len(cluster_centers_indices)
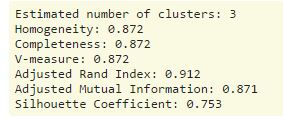
print('Estimated number of clusters: %d' % n_clusters_)
print("Homogeneity: %0.3f" % metrics.homogeneity_score(labels_true, labels))
print("Completeness: %0.3f" % metrics.completeness_score(labels_true, labels))
print("V-measure: %0.3f" % metrics.v_measure_score(labels_true, labels))
print("Adjusted Rand Index: %0.3f"
% metrics.adjusted_rand_score(labels_true, labels))
print("Adjusted Mutual Information: %0.3f"
% metrics.adjusted_mutual_info_score(labels_true, labels))
print("Silhouette Coefficient: %0.3f"
% metrics.silhouette_score(X, labels, metric='sqeuclidean'))
# #############################################################################
# Plot result
import matplotlib.pyplot as plt
from itertools import cycle
plt.close('all')
plt.figure(1)
plt.clf()
colors = cycle('bgrcmykbgrcmykbgrcmykbgrcmyk')
for k, col in zip(range(n_clusters_), colors):
class_members = labels == k
cluster_center = X[cluster_centers_indices[k]]
plt.plot(X[class_members, 0], X[class_members, 1], col + '.')
plt.plot(cluster_center[0], cluster_center[1], 'o', markerfacecolor=col,
markeredgecolor='k', markersize=14)
for x in X[class_members]:
plt.plot([cluster_center[0], x[0]], [cluster_center[1], x[1]], col)
plt.title('Estimated number of clusters: %d' % n_clusters_)
plt.show()

閱讀更多精彩內容,請關注微信公眾號:統計學習與大資料