使用matplotlib實現啟用函式的數學公式圖
阿新 • • 發佈:2018-12-19
程式碼實現:
import numpy as np
import matplotlib.pyplot as plt
# 正常顯示中文標籤
plt.rcParams['font.sans-serif'] = ['SimHei']
x = np.linspace(-6, 6, 1000)
# 實現公式
# 將對應啟用函式的公式實現程式碼貼上到這
# 定義視窗
plt.figure("啟用函式")
# 畫線,
plt.plot(x, y, label='啟用函式')
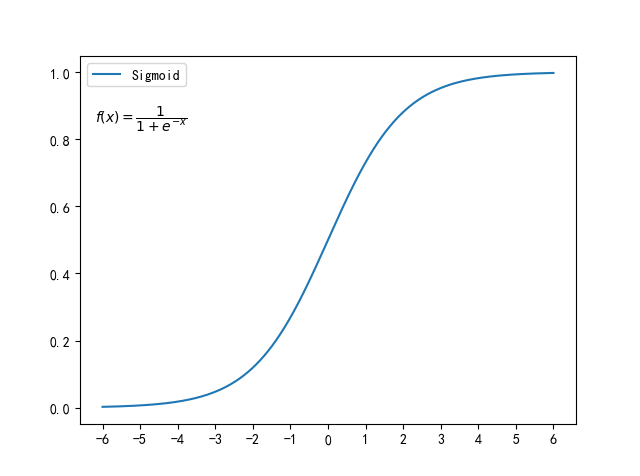
plt.xticks([-i for i in range(6, 0,-1)]+[i for i in range(7)], ['{}' 1. sigmoid
數學表示式:
實現程式碼:
# 實現公式
number = np.divide(1, (1+np.exp(-number1)))
# 標註
plt.text(-6.2, 0.85, r'$f(x) = \dfrac{1}{1+e^{-x}}$')
效果圖:
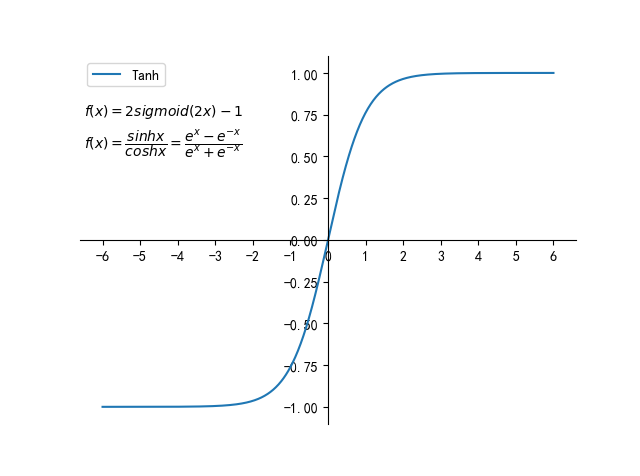
2. Tanh
數學表示式: 實現程式碼:
# 實現公式1:
number = 2*np.divide(1, (1+np.exp(-2*number1)))-1
# 實現公式2:
number = np.divide(np.exp(number1)-np.exp(-number1), np.exp(number1)+ np.exp(-number1))

# 標註
plt.text(-6.5, 0.75, r'$f(x) = 2sigmoid(2x)-1$')
plt.text(-6.5, 0.55, r'$f(x) = \dfrac{sinhx}{coshx}=\dfrac{e^x-e^{-x}}{e^x+e^{-x}}$')
效果圖:
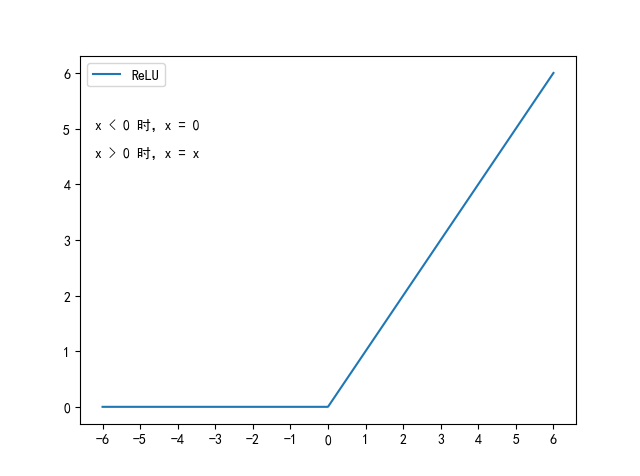
3. ReLU
數學表示式: 實現程式碼:
# 實現公式:
number = []
for i in number1:
    if i < 0:
        number.append(0)
    else:
        number.append(i)

# 標註
plt.text(-6.2, 5, 'x < 0 時,'+'x = 0')
plt.text(-6.2, 4.5, 'x > 0 時,'+'x = x')
效果圖:
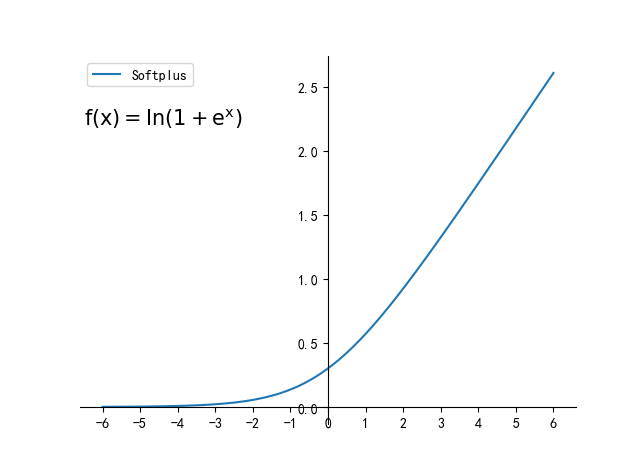
4. Softplus
數學表示式: 實現程式碼:
# 實現公式:
number = np.log10(1.0 + np.exp(number1))
# 標註:
plt.text(-6.4, 2.2, 'f(x)=In(1+e^x)', fontsize=15)
效果圖:
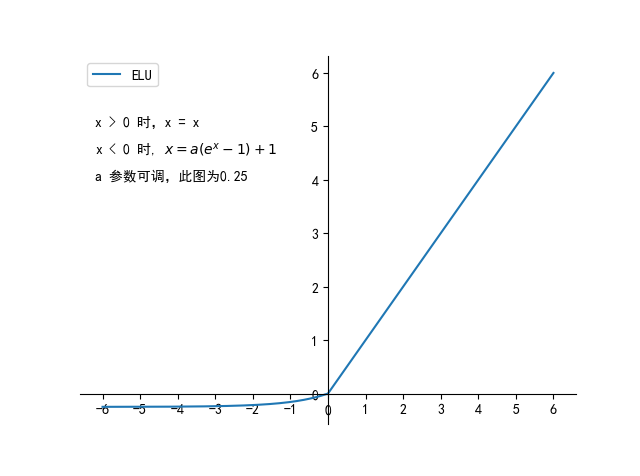
5. ELU
數學表示式: 實現程式碼:
# 實現公式
number = []
for i in number1:
    if i <= 0:
        number.append(0.25*(np.exp(i)-1))
    else:
        number.append(i)
# 標註
plt.text(-6.2, 5, 'x > 0 時,x = x')
plt.text(-6.2, 4.5, r'x < 0 時, $x = a(e^x-1)+1$ ' )
plt.text(-6.2, 4, 'a 引數可調,此圖為0.25')
效果圖:
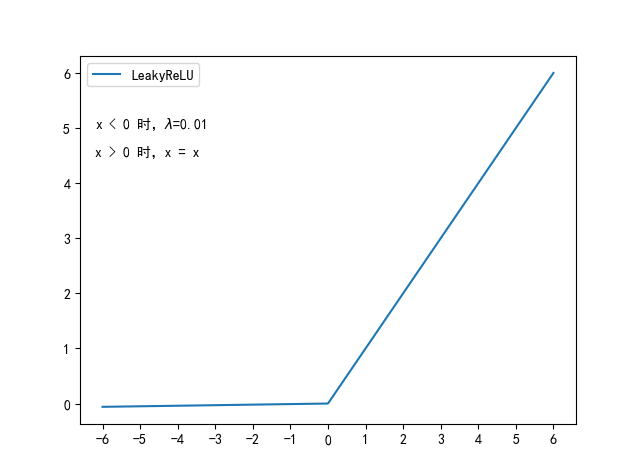
6. LeakyReLU
數學表示式:
實現程式碼:
# 實現LeakyReLU公式
number = []
for i in number1:
    if i < 0:
        number.append(i*0.01)
    else:
        number.append(i)

# 標註
plt.text(-6.2, 5, 'x < 0 時,'+r'$\lambda$'+'=0.01')
plt.text(-6.2, 4.5, 'x > 0 時,'+'x = x')
效果圖: