用Python學分析 - 正態分佈
阿新 • • 發佈:2018-12-29
正態分佈(Normal Distribution)
1、正態分佈是一種連續分佈,其函式可以在實線上的任何地方取值。
2、正態分佈由兩個引數描述:分佈的平均值μ和方差σ2 。
3、正態分佈的取值可以從負無窮到正無窮。
3、Z-score 是非標準正態分佈標準化後的x 即 z = (x−μ) / σ
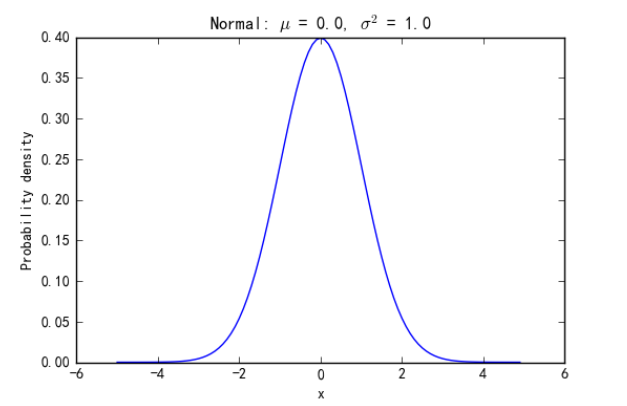
#顯示標準正態分佈曲線圖


1 import numpy as np 2 import scipy.stats as stats 3 import matplotlib.pyplot as plt 4 5 mu = 0 # mean 6 sigma = 1 #View Codestandart deviation 7 x = np.arange(-5, 5, 0.1) 8 y = stats.norm.pdf(x, 0, 1) 9 print('Chart 1:') 10 plt.plot(x, y) 11 plt.title('Normal: $\mu$ = {0:.1f}, $\sigma^2$ = {1:0.1f}'.format(mu, sigma)) 12 plt.xlabel('x') 13 plt.ylabel('Probability density') # probobility of observing each of these observations14 plt.show()
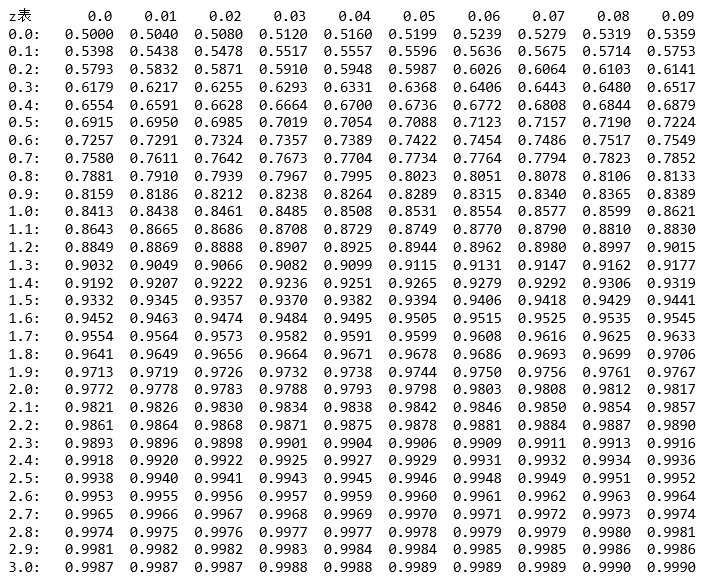
標準正態分佈表
表頭的橫向表示小數點後第二位,表頭的縱向則為整數部分以及小數點後第一位;兩者聯合作為完整的x,座標軸的橫軸
# 顯示標準正態分佈表格
1 import numpy as np 2 from scipy.stats import norm 3 4 n = 100 5 x = np.arange(0, 0.1, 0.01) 6 y = np.arange(0, 3.1, 0.1) 7 print('z表 ', end = '') 8 for j in x: 9 printView Code( str(j), end=' ') 10 print() 11 for i in y: 12 print( i , end = ': ') 13 for j in x: 14 z = norm.cdf(j+i) 15 print('{0:.4f}'.format(z), end = ' ') 16 print('')