
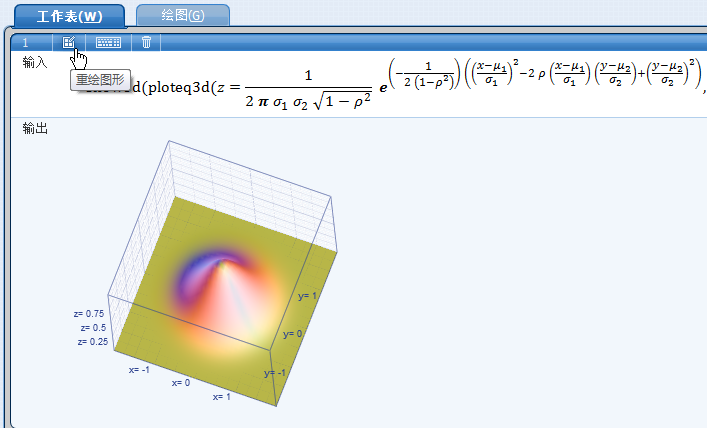
二維正態分佈的引數與概率密度圖形
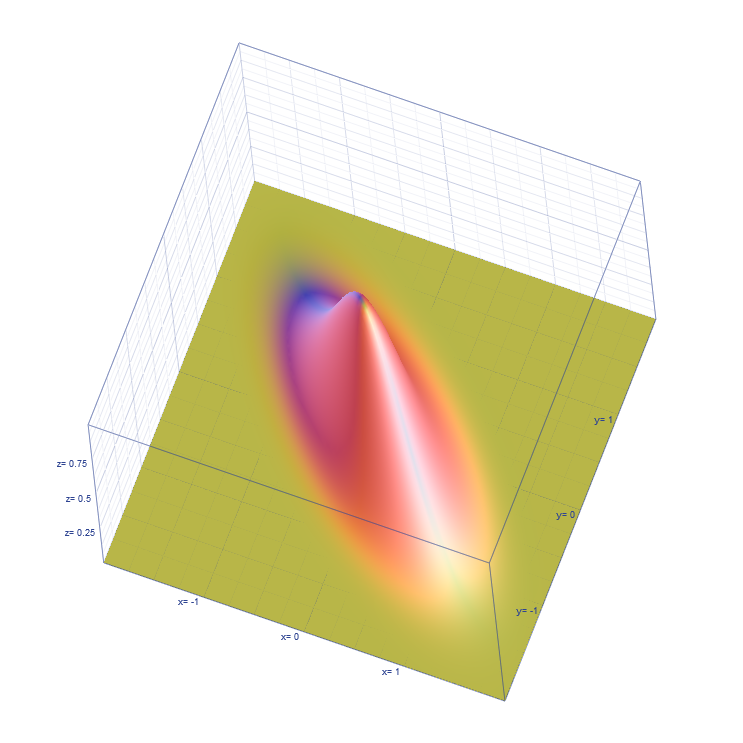
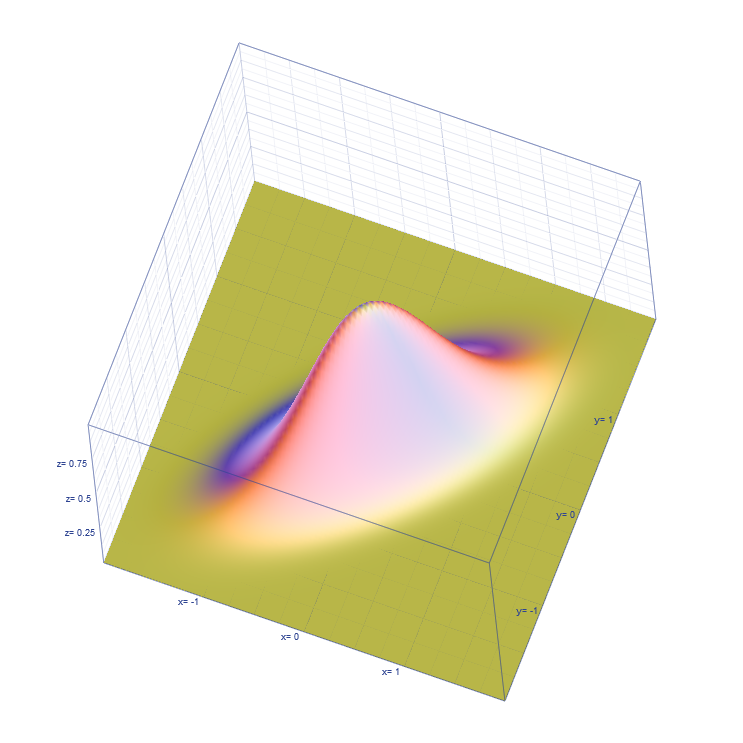
用Microsoft Mathematics繪製二維正態分佈的概率密度圖形,引數可以互動地調整。
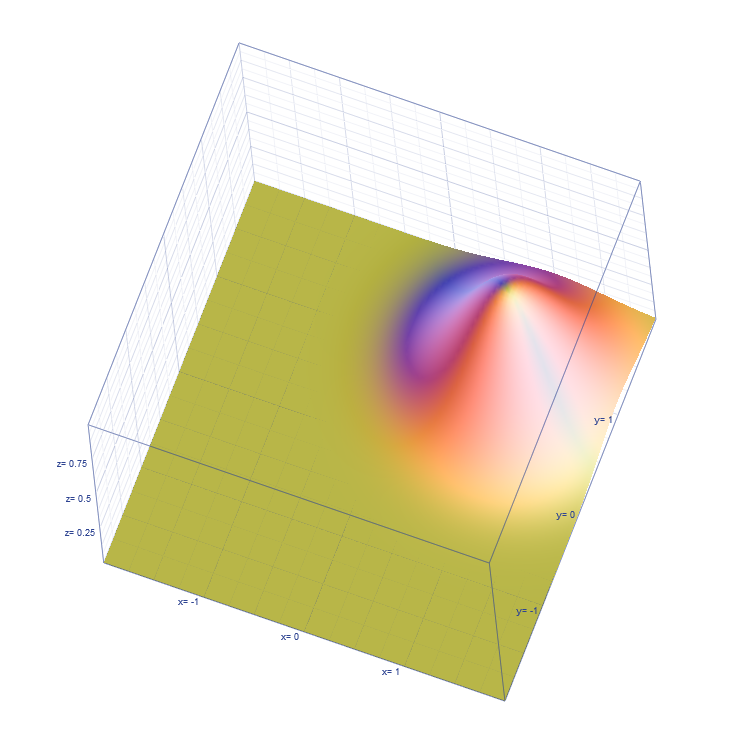
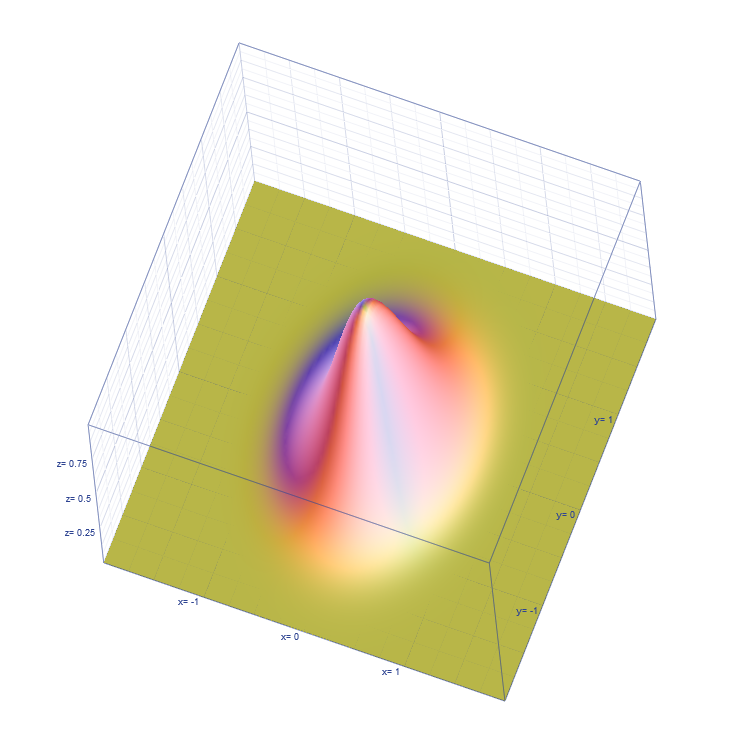
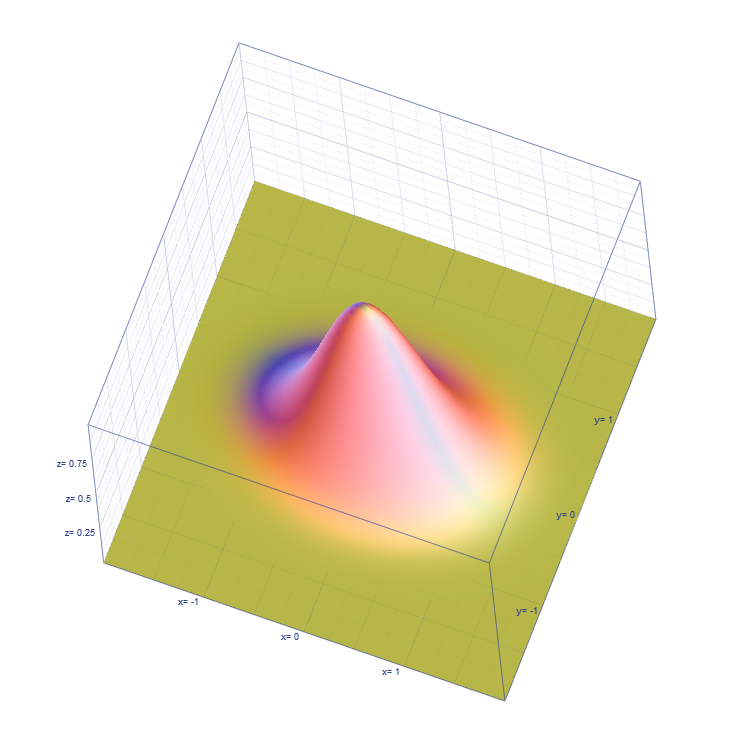
N(μ1, μ2; σ1, σ2, ρ)
μ1 = 1, μ2 = 1, σ1 = 0.49, σ2 = 0.49, ρ = 0
μ1 = 0, μ2 = 0, σ1 = 0.49, σ2 = 0.49, ρ = 0

μ1 = 0, μ2 = 0, σ1 = 0.334, σ2 = 0.49, ρ = 0
μ1 = 0, μ2 = 0, σ1 = 0.49, σ2 = 0.334, ρ = 0
μ1 = 0, μ2 = 0, σ1 = 0.49, σ2 = 0.49, ρ = -0.738
μ1 = 0, μ2 = 0, σ1 = 0.49, σ2 = 0.49, ρ = 0.738
相關推薦
二維正態分佈的引數與概率密度圖形
用Microsoft Mathematics繪製二維正態分佈的概率密度圖形,引數可以互動地調整。 N(μ1, μ2; σ1, σ2, ρ) μ1 = 1, μ2 = 1, σ1 = 0.49, σ2 = 0.49, ρ = 0 μ1
一維正態分佈、二維正態分佈的matlab實現
%%%%%%%%%%%%%%%%%%%%%%%%%%%%%%%%%%%%%%%%%% %本程式用於產生一維正態分佈、二維正態分佈 %%%%%%%%%%%%%%%%%%%%%%%%%%%%%%%%%%%%%%%%%% %繪製一維正態分佈 x=linspace(-3,3); y
機器視覺學習之--貝葉斯學習 MATLAB二維正態分佈二維圖
1、貝葉斯介紹 我個人一直很喜歡演算法一類的東西,在我看來演算法是人類智慧的精華,其中蘊含著無與倫比的美感。而每次將學過的演算法應用到實際中,並解決了實際問題後,那種快感更是我在其它地方體會不到的。 一直想寫關於演算法的博文,也曾寫過零散的兩篇,但也許是相
matlab:畫二維正態分佈密度函式圖
首先,把二維正態分佈密度函式的公式貼這裡 這隻圖好大啊~~ 但是上面的那個是多維正態分佈的密度函式的通式,那個n階是對稱正定方陣叫做協方差矩陣,其中的x,pi,u都是向量形式。雖然這個式子很酷,但是用在matlab裡畫圖不太方面,下面換一個 這個公式與上面
關於多元正態分佈的條件概率密度
多元正態分佈 多元正態分佈的密度函式如下 : fx(x1,...xn)=1(2π)k√|Σ|1/2exp(−12(x−μ)TΣ−1(x−μ)) (1) 其對應的矩母函式(也有稱動差函式)為exp(μTt+12tTΣt)。事實上,如果隨機向量[X1
Matlab從多維正態分佈中隨機抽取樣本:mvnrnd
原帖地址:http://blog.sina.com.cn/s/blog_955cedd8010130m8.html R = mvnrnd(MU,SIGMA)——從均值為MU,協方差為SIGMA的正態分佈中抽取n*d的矩陣R(n代表抽取的個數,d代表分佈的維數)。
python 生成隨機一維或多維正態分佈
作者:採石工 連結:https://www.zhihu.com/question/39823283/answer/115241445 來源:知乎 著作權歸作者所有,轉載請聯絡作者獲得授權。 # coding=utf-8 import numpy as np from
Matlab 從多維正態分佈中隨機抽取樣本:mvnrnd
R = mvnrnd(MU,SIGMA)——從均值為MU,協方差為SIGMA的正態分佈中抽取n*d的矩陣R(n代表抽取的個數,d代表分佈的維數)。MU為n*d的矩陣,R中的每一行為以MU中對應的行為均值的正態分佈中抽取的一個樣本。SIGMA為d*d的對稱半正定矩陣,或者為d*d*n的array。若SIGMA為
R語言︱分佈函式與概率密度+隨機數產生
1、常見概率分佈##正態分佈 pnorm(1.96) #P(x<=1.96)時的分佈概率 pnorm(1.96,0,1) #上同 pnorm(1
【概率與統計】正態分佈(Normal Distribution)
連續型隨機變數最常用的分佈就是 正態分佈(normal distribution),也稱為高斯分佈(Gaussian distribution): N(x;μ,σ2)=12πσ2−−−−√exp(−12σ2(x−μ)2)N(x;μ,σ2)=12πσ2exp(−1
連續型概率分佈——正態分佈(一維)
今天想總結一下正太分佈,但是如果按照維基百科上面的講法,就太過複雜了,所以這裡著重講正態分佈在實際生活中的作用以及簡單的計算方法,也就是高中所學過的關於正態分佈的知識。在正式開始之前,還是把維基百科上面的科普拎出來過一遍正態分佈又名高斯分佈,是一個在數學、物理及工程等領域都非
二維高斯正態分佈函式(轉)
二維高斯正態分佈函式(原創) 二維高斯正態分佈函式在很多地方都用的到,比如說在濾波中,自己編了個,但感覺IDL中應該有現成的函式??(我沒找到)。如有,請高手指點。 ;------------
泊松分佈 二項分佈 正態分佈之間的聯絡,與繪製高斯分佈圖
基礎知識 二項分佈有兩個引數,一個 n 表示試驗次數,一個 p 表示一次試驗成功概率。現在考慮一列二項分佈,其中試驗次數 n 無限增加,而 p 是 n 的函式。 1.如果 np 存在有限極限 λ,則這列二項分佈就趨於引數為 λ 的 泊松分佈。反之,如果 np 趨於
正態分佈(normal distribution)與偏態分佈(skewed distribution)
分享一下我老師大神的人工智慧教程!零基礎,通俗易懂!http://blog.csdn.net/jiangjunshow 也歡迎大家轉載本篇文章。分享知識,造福人民,實現我們中華民族偉大復興!
MATLAB繪製正態分佈概率密度函式(normpdf)圖形
這裡是一個簡單的實現程式碼 x=linspace(-5,5,50); %生成負五到五之間的五十個數,行向量 y=normpdf(x,0,1); plot(x,y,‘k’); 圖片複製不過來。。就擺個連結好了 https://jingyan.baidu.com/article/6fb756ec
二維高斯分佈(Two-dimensional Gaussian distribution)的引數分析
最近在看高斯混合模型(Gaussian Mixture Model, GMM),涉及到高斯分佈的引數。為此特意回顧了概率論的二維高斯分佈的相關概念,並分析了引數對二維高斯分佈曲面的影響。 1、多維高斯分佈的概率密度函式 多維變數X
正態分佈(Normal distribution)與高斯分佈(Gaussian distribution)
正態分佈(Normal distribution)又名高斯分佈(Gaussian distribution),是一個在數學、物理及工程等領域都非常重要的概率分佈,在統計學的許多方面有著重大的影響力。 若隨機變數X服從一個數學期望為μ、標準方差為σ2的高斯分佈,記為: X
漫步數理統計二十六——多元正態分佈
本片博文介紹多元正態分佈,我們以n維隨機變數為主,但給出n=2時二元情況的一些例項。與上篇文章一樣,我們首先介紹標準情況然後擴充套件到一般情況,當然這裡會用到向量與矩陣符號。 考慮隨機向量Z=(Z1,…,Zn)′,其中Z1,…,Zn是獨立同分布的N(0,1)隨
從二項分佈到泊松分佈再到正態分佈
如果忽略分佈是離散還是連續的前提(二項分佈和泊松分佈一樣都是離散型概率分佈,正態分佈是連續型概率分佈),二項分佈與泊松分佈以及正態分佈至少在形狀上是十分接近的,也即兩邊低中部高。 由從 Poisson
Matlab中的正態分佈概率函式
normcdf函式用來獲得正態分佈的概率分佈函式; 也就是 normcdf(x)=Pr{Z≤x}, 這裡Z是均值為0,方差為1的標準正態隨機變數. 若想獲得均值為 μ,方差為 σ的概率分佈函式: normcdf(x,mu,sigma) 即可. no