
Matlab繪製三維曲面
阿新 • • 發佈:2019-02-06
平面網格點的生成
Matlab用meshgrid函式來生成x-y平面上的小矩形頂點座標, 呼叫格式如下:
[X, Y] = meshgrid(x,y)
網格曲面
利用meshgrid生成網格點之後,可以用mesh來繪製網格曲面。
例子:
x = -8:0.5:8;
y = x;
[X, Y] = meshgrid(x, y);
R = sqrt(X.^2 + Y.^2) + eps;
Z = sin(R)./R;
subplot(3,3,1), mesh(Z);
subplot(3,3,2), mesh(x, y, Z);
subplot(3,3,3), mesh(X, Y, Z);
subplot(3 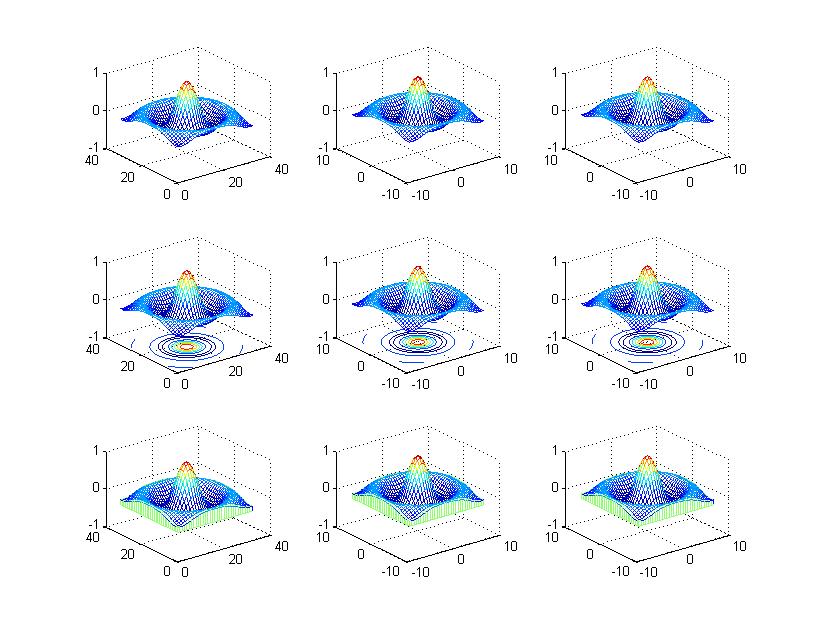
實曲面
使用surf or surfl 替代mesh
例子:
x = -8:0.5:8;
y = x;
[X, Y] = meshgrid(x, y);
R = sqrt(X.^2 + Y.^2) + eps;
Z = sin(R)./R;
subplot(2 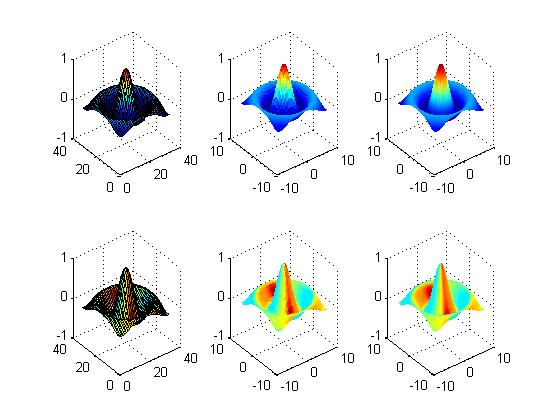
end