
Prometheus 入門教程(一):Prometheus 快速入門
阿新 • • 發佈:2020-10-15
# 文章首發於【陳樹義】公眾號,點選跳轉到原文:https://mp.weixin.qq.com/s/ZXlBPHGcWeYh2hjBzacc3A
Prometheus 是任何一個高階工程師必須要掌握的技能。那麼如何從零部署一套 Prometheus 監控系統呢?本篇文章將從 Prometheus 的原理講起,手把手帶你用一個最簡單的例子部署一套 Prometheus 監控系統。
## 基本原理
Prometheus的基本架構如下圖所示:

從上圖可以看到,整個 Prometheus 可以分為四大部分,分別是:
* **Prometheus 伺服器**
Prometheus Server 是 Prometheus元件中的核心部分,負責實現對監控資料的獲取,儲存以及查詢。
* **NodeExporter 業務資料來源**
業務資料來源通過 Pull/Push 兩種方式推送資料到 Prometheus Server。
* **AlertManager 報警管理器**
Prometheus 通過配置報警規則,如果符合報警規則,那麼就將報警推送到 AlertManager,由其進行報警處理。
* **視覺化監控介面**
Prometheus 收集到資料之後,由 WebUI 介面進行視覺化圖示展示。目前我們可以通過自定義的 API 客戶端進行呼叫資料展示,也可以直接使用 Grafana 解決方案來展示。
簡單地說,Prometheus 的實現架構也並不複雜。**其實就是收集資料、處理資料、視覺化展示,再進行資料分析進行報警處理。** 但其珍貴之處在於提供了一整套可行的解決方案,並且形成了一整個生態,能夠極大地降低我們的研發成本。

# 文章首發於【陳樹義】公眾號,點選跳轉到原文:https://mp.weixin.qq.com/s/ZXlBPHGcWeYh2hjBzacc3A
## 快速入門
下面我們通過一個簡單的例子來實現對伺服器 CPU、記憶體等硬體資訊的監控。
### 安裝執行 Prometheus 服務端
Prometheus 服務端負責資料的收集,因此我們應該首先安裝並執行 Prometheus Server。
從 [https://prometheus.io/download/](https://prometheus.io/download/) 找到最新版本的Prometheus Sevrer軟體包:

下載後解壓,可以看到如下目錄結構:

其中 data 目錄是資料的儲存路徑,也可以通過執行時的 `--storage.tsdb.path="data/"` 命令另行指定。Prometheus.yml 是 Prometheus的配置檔案,prometheus 是執行的命令。
啟動prometheus服務,其會預設載入當前路徑下的prometheus.yaml檔案。當然我們也可以手動指定配置檔案地址:
```
./prometheus --config.file=prometheus.yml
```
# 文章首發於【陳樹義】公眾號,點選跳轉到原文:https://mp.weixin.qq.com/s/ZXlBPHGcWeYh2hjBzacc3A
正常的情況下,你可以看到以下輸出內容:
```
level=info ts=2020-07-18T06:48:52.454Z caller=main.go:694 fs_type=18
level=info ts=2020-07-18T06:48:52.454Z caller=main.go:695 msg="TSDB started"
level=info ts=2020-07-18T06:48:52.454Z caller=main.go:799 msg="Loading configuration file" filename=prometheus.yml
level=info ts=2020-07-18T06:48:53.056Z caller=main.go:827 msg="Completed loading of configuration file" filename=prometheus.yml
level=info ts=2020-07-18T06:48:53.056Z caller=main.go:646 msg="Server is ready to receive web requests."
```
輸入 `http://localhost:9090/graph` 可以看到如下頁面,這個是 Prometheus 自帶的監控管理介面。

### 執行 NodeExporter 客戶端資料來源
NodeExporter 是 Prometheus 提供的一個可以採集到主機資訊的應用程式,它能採集到機器的 CPU、記憶體、磁碟等資訊。
我們從 [https://prometheus.io/download/](https://prometheus.io/download/) 獲取最新的 Node Exporter 版本的二進位制包。

下載解壓後執行 Node Exporter,我們指定用 8080 埠執行:
```
./node_exporter --web.listen-address 127.0.0.1:8080
```
啟動成功後,可以看到以下輸出:
```
level=info ts=2020-07-18T06:52:42.132Z caller=node_exporter.go:191 msg="Listening on" address=127.0.0.1:8080
level=info ts=2020-07-18T06:52:42.132Z caller=tls_config.go:170 msg="TLS is disabled and it cannot be enabled on the fly." http2=false
```
訪問 `http://localhost:8080/` 可以看到以下頁面:

訪問 `http://localhost:8080/metrics`,可以看到當前 node exporter 獲取到的當前主機的所有監控資料,如下所示:

每一個監控指標之前都會有一段類似於如下形式的資訊:
```
# HELP node_cpu Seconds the cpus spent in each mode.
# TYPE node_cpu counter
node_cpu{cpu="cpu0",mode="idle"} 362812.7890625
# HELP node_load1 1m load average.
# TYPE node_load1 gauge
node_load1 3.0703125
```
其中 HELP 用於解釋當前指標的含義,TYPE 則說明當前指標的資料型別。
在上面的例子中 node_cpu 的註釋表明當前指標是 cpu0 上 idle 程序佔用 CPU 的總時間,CPU 佔用時間是一個只增不減的度量指標,從型別中也可以看出 node_cpu 的資料型別是計數器(counter),與該指標的實際含義一致。
又例如node_load1該指標反映了當前主機在最近一分鐘以內的負載情況,系統的負載情況會隨系統資源的使用而變化,因此node_load1反映的是當前狀態,資料可能增加也可能減少,從註釋中可以看出當前指標型別為儀表盤(gauge),與指標反映的實際含義一致。
除了這些以外,在當前頁面中根據物理主機系統的不同,你還可能看到如下監控指標:
```
node_boot_time:系統啟動時間
node_cpu:系統CPU使用量
nodedisk*:磁碟IO
nodefilesystem*:檔案系統用量
node_load1:系統負載
nodememeory*:記憶體使用量
nodenetwork*:網路頻寬
node_time:當前系統時間
go_*:node exporter中go相關指標
process_*:node exporter自身程序相關執行指標
```
### 配置 Prometheus 的監控資料來源
現在我們運行了 Prometheus 伺服器,也運行了業務資料來源 NodeExporter。但此時 Prometheus 還獲取不到任何資料,我們還需要配置下 prometheus.yml 檔案,讓其去拉取 Node Exporter 的資料。
我們配置一下 Prometheus 的配置檔案,讓 Prometheus 伺服器定時去業務資料來源拉取資料。編輯prometheus.yml 並在 scrape_configs 節點下新增以下內容:
```
scrape_configs:
- job_name: 'prometheus'
static_configs:
- targets: ['localhost:9090']
# 採集node exporter監控資料
- job_name: 'node'
static_configs:
- targets: ['localhost:8080']
```
上面配置檔案配置了兩個任務。一個是名為 prometheus 的任務,其從「localhost:9090」地址讀取資料。另一個是名為 node 的任務,其從「localhost:8080」地址讀取資料。
配置完成後,我們重新啟動 Prometheus。
```
./prometheus --config.file=prometheus.yml
```
### 查詢監控資料
配置完 Prometheus 讀取的資料來源之後,Prometheus 便可以從 Node Exporter 獲取到資料了。那麼接下來我們如何檢視到這些資料呢?答案是:Prometheus UI!
Prometheus UI 是 Prometheus 內建的一個視覺化管理介面,我們通過 `http://localhost:9090` 就可以訪問到該頁面。
通過 Prometheus UI 可以查詢 Prometheus 收集到的資料,而 Prometheus 定義了 PromQL 語言來作為查詢監控資料的語言,其餘 SQL 類似。
接下來我們訪問 `http://localhost:9090`,進入到 Prometheus Server。如果輸入「up」並且點選執行按鈕以後,可以看到如下結果:

可以看到 `Element` 處有幾條記錄,其中 instance 值為 localhost:8080 的記錄,value 是 1,這代表對應應用是存活狀態。
```
up{group="production",instance="localhost:8080",job="node"} 1
```
例如檢視我們所執行 NodeExporter 節點所在機器的記憶體使用情況,可以輸入 `node_memory_active_bytes/(1024*1024*1024)` 檢視。

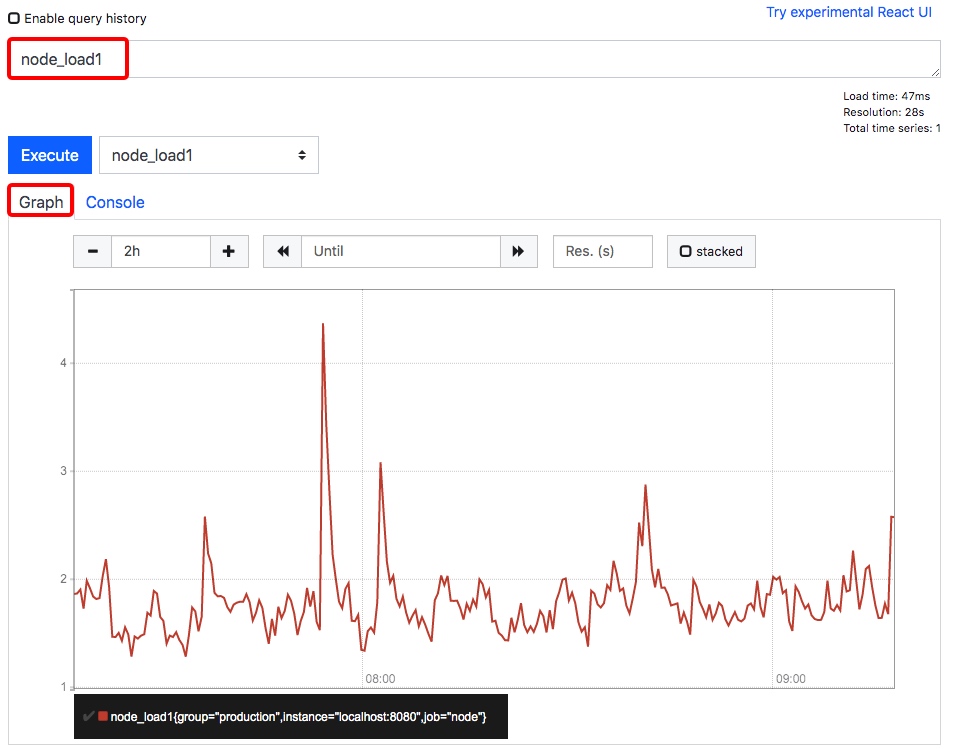
檢視 NodeExporter 節點所在機器 CPU 1 分鐘的負載情況,可以輸入 `node_load1` 即可檢視。
到這裡,我們基本上為完成了資料的收集過程,即資料從業務側收集到 Prometheus 側,並且還學會了如何使用 Prometheus 自帶的控制檯。
# 文章首發於【陳樹義】公眾號,點選跳轉到原文:https://mp.weixin.qq.com/s/ZXlBPHGcWeYh2hjBzacc3A
## 總結
這篇文章我們從 Prometheus 的原理入門,剖析了 Prometheus 實現的原理,並且用一個簡單的例子從零實現了一套業務監控系統。通過 Prometheus UI,我們可以實時獲取到機器的存活資訊、CPU、記憶體資訊。
# 文章首發於【陳樹義】公眾號,點選跳轉到原文:https://mp.weixin.qq.com/s/ZXlBPHGcWeYh2h