
爬蟲實戰:爬蟲加資料分析,重慶電氣小哥一文帶你分析重慶所有旅遊景點
阿新 • • 發佈:2021-02-18
寒假已經到了,玩是要玩的,作為一個地地道道的重慶電網小哥,今天想用python爬蟲+資料分析 的方式告訴你重慶哪些地方好玩。
先上一張最後景區地點分佈結果圖
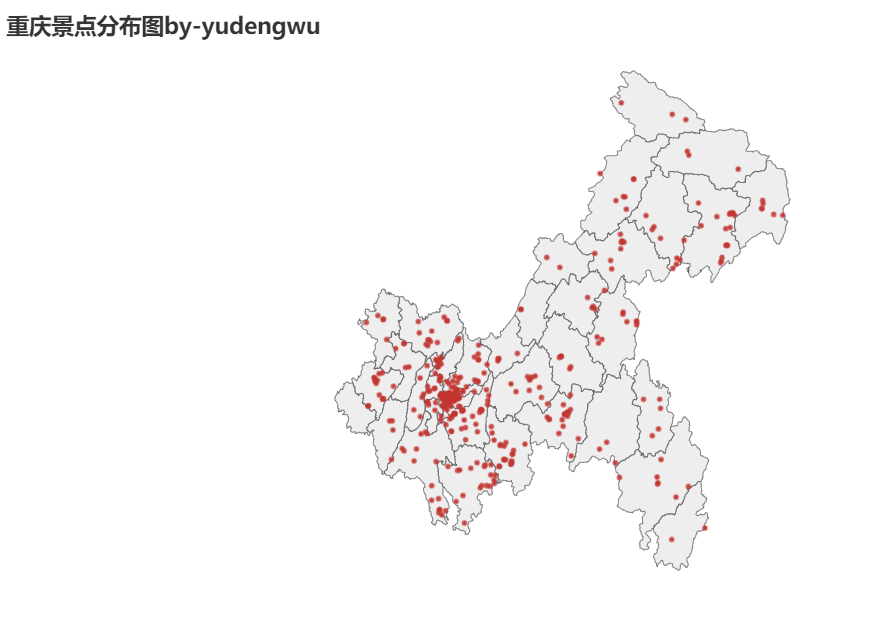
資料來源:去哪兒旅行
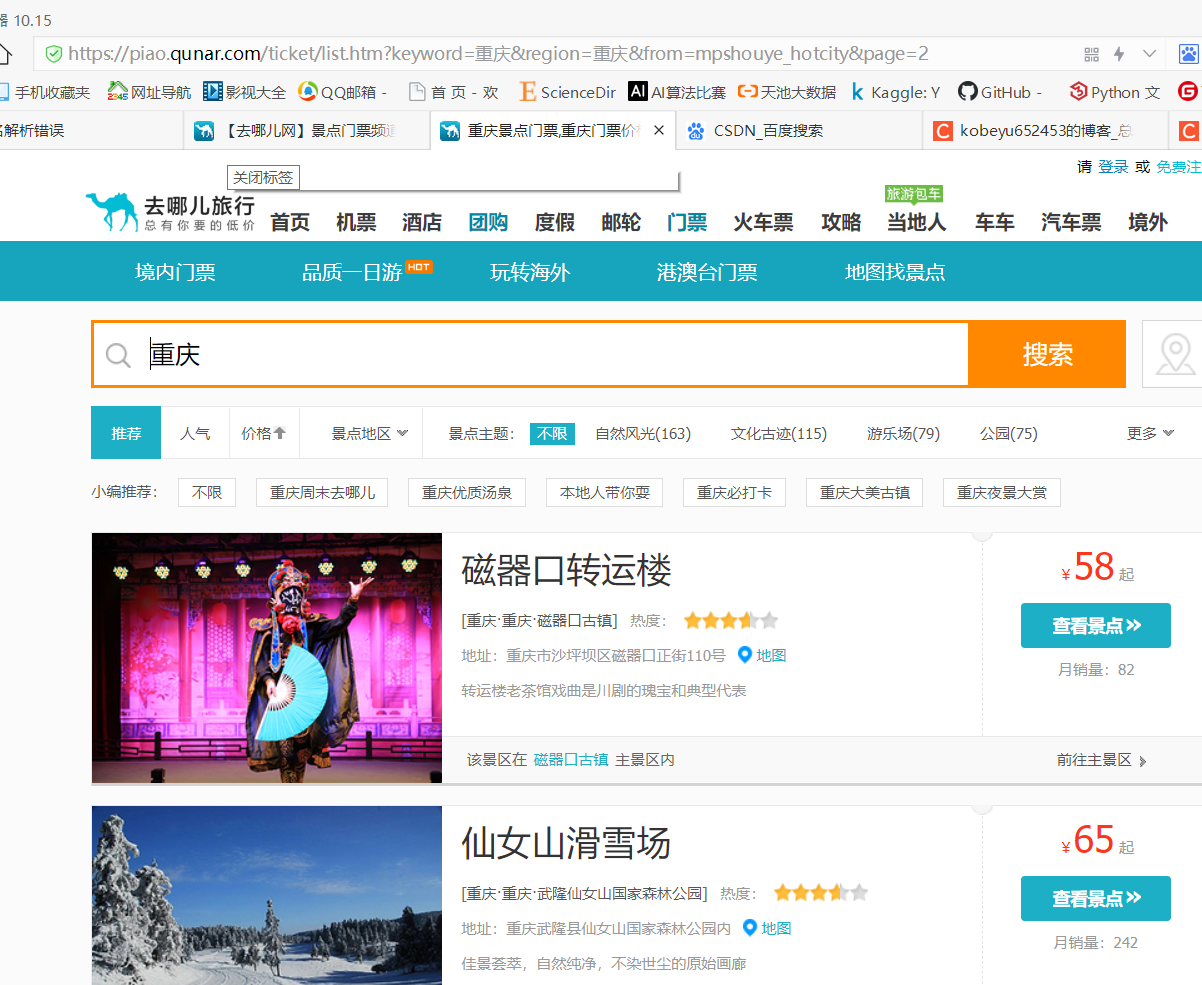
用request請求到json資料

第一部分:爬蟲
資料搜尋:小試牛刀
import requests
keyword = "重慶"
page=1#列印第一頁
headers = {"User-Agent": "Mozilla/5.0 (Windows NT 10.0; WOW64) AppleWebKit/537.36 (KHTML, like Gecko) Chrome/69.0.3947.100 Safari/537.36" 結果

json返回的資料格式是字典型,我們需要從中找到我感興趣的關鍵詞
發現我們感興趣的是sightList

於是可以修改程式碼為
import requests
keyword = "重慶"
page=1
headers = {"User-Agent": "Mozilla/5.0 (Windows NT 10.0; WOW64) AppleWebKit/537.36 (KHTML, like Gecko) Chrome/69.0.3947.100 Safari/537.36"}
url = f'http://piao.qunar.com/ticket/list.json?keyword={keyword}®ion=&from=mpl_search_suggest&page={page}' 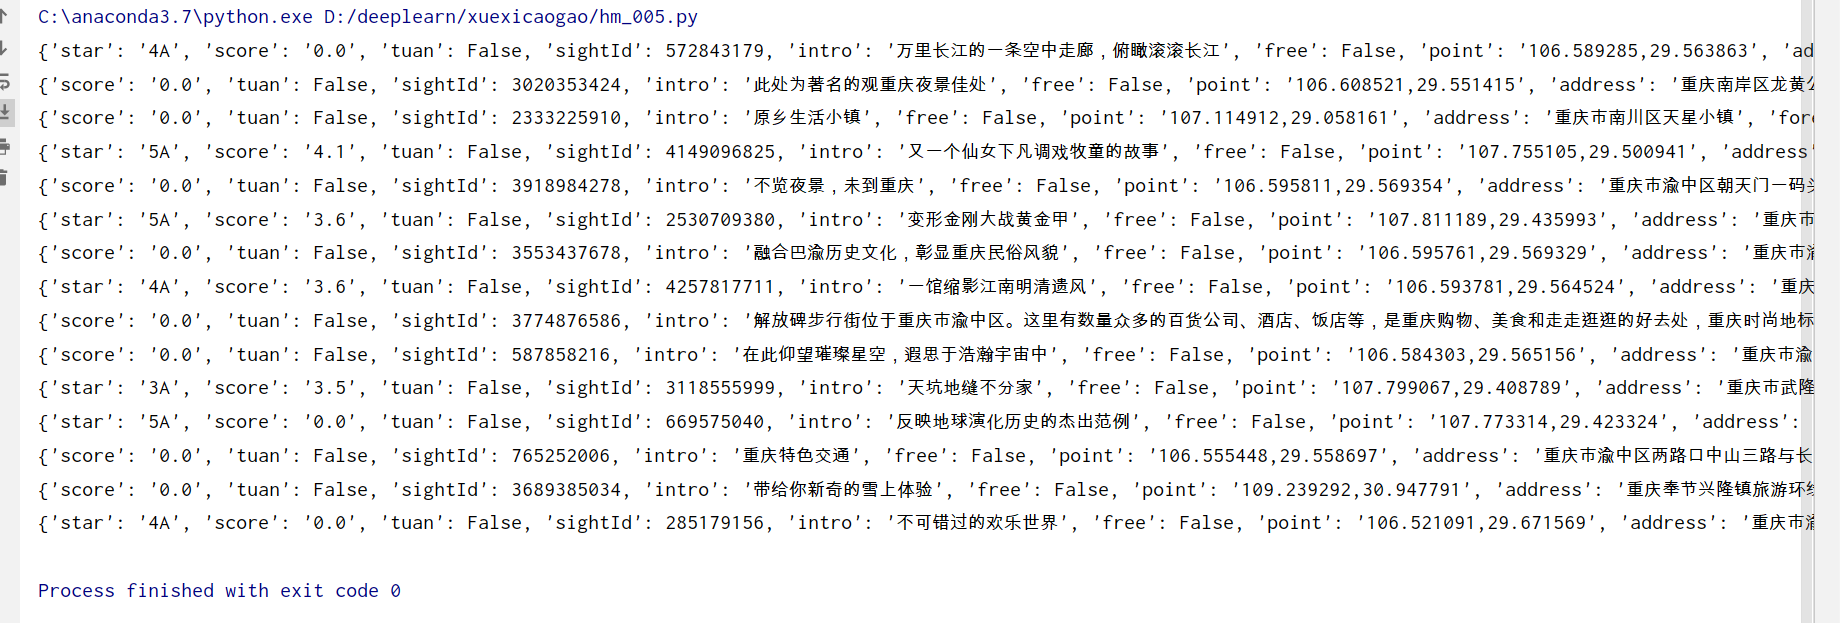
再次提取資訊,修改程式碼為
import requests
import pandas as pd
keyword = "重慶"
page=1#檢視第一頁
headers = {"User-Agent": "Mozilla/5.0 (Windows NT 10.0; WOW64) AppleWebKit/537.36 (KHTML, like Gecko) Chrome/69.0.3947.100 Safari/537.36"}
url = f'http://piao.qunar.com/ticket/list.json?keyword={keyword}®ion=&from=mpl_search_suggest&page={page}'
res = requests.request("GET", url, headers=headers)
res_json = res.json()
sightLists = res_json['data']['sightList']#sightList是感興趣的
for sight in sightLists:
name=(sight['sightName'] if 'sightName' in sight.keys() else None)#名稱
districts=(sight['districts'] if 'districts' in sight.keys() else None)#地址
star=(sight['star'] if 'star' in sight.keys() else None) #星級
qunarPrice=(sight['qunarPrice'] if 'qunarPrice' in sight.keys() else None)#最低價格
saleCount=(sight['saleCount'] if 'saleCount' in sight.keys() else None)#購買人數
score=(sight['score'] if 'score' in sight.keys() else None )#評分
point=(sight['point'] if 'point' in sight.keys() else None )#座標位置
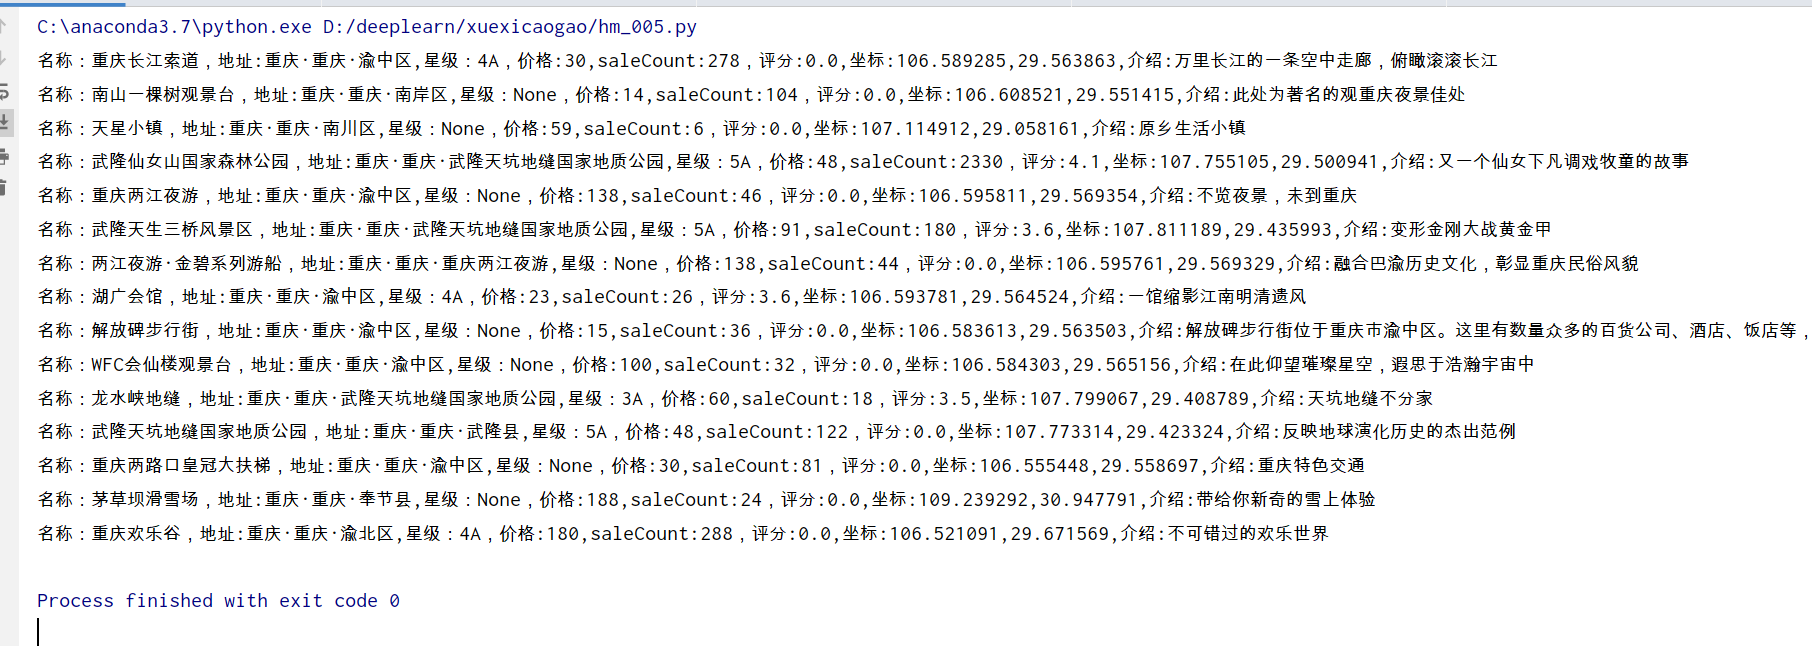
intro=(sight['intro'] if 'intro' in sight.keys() else None)#介紹
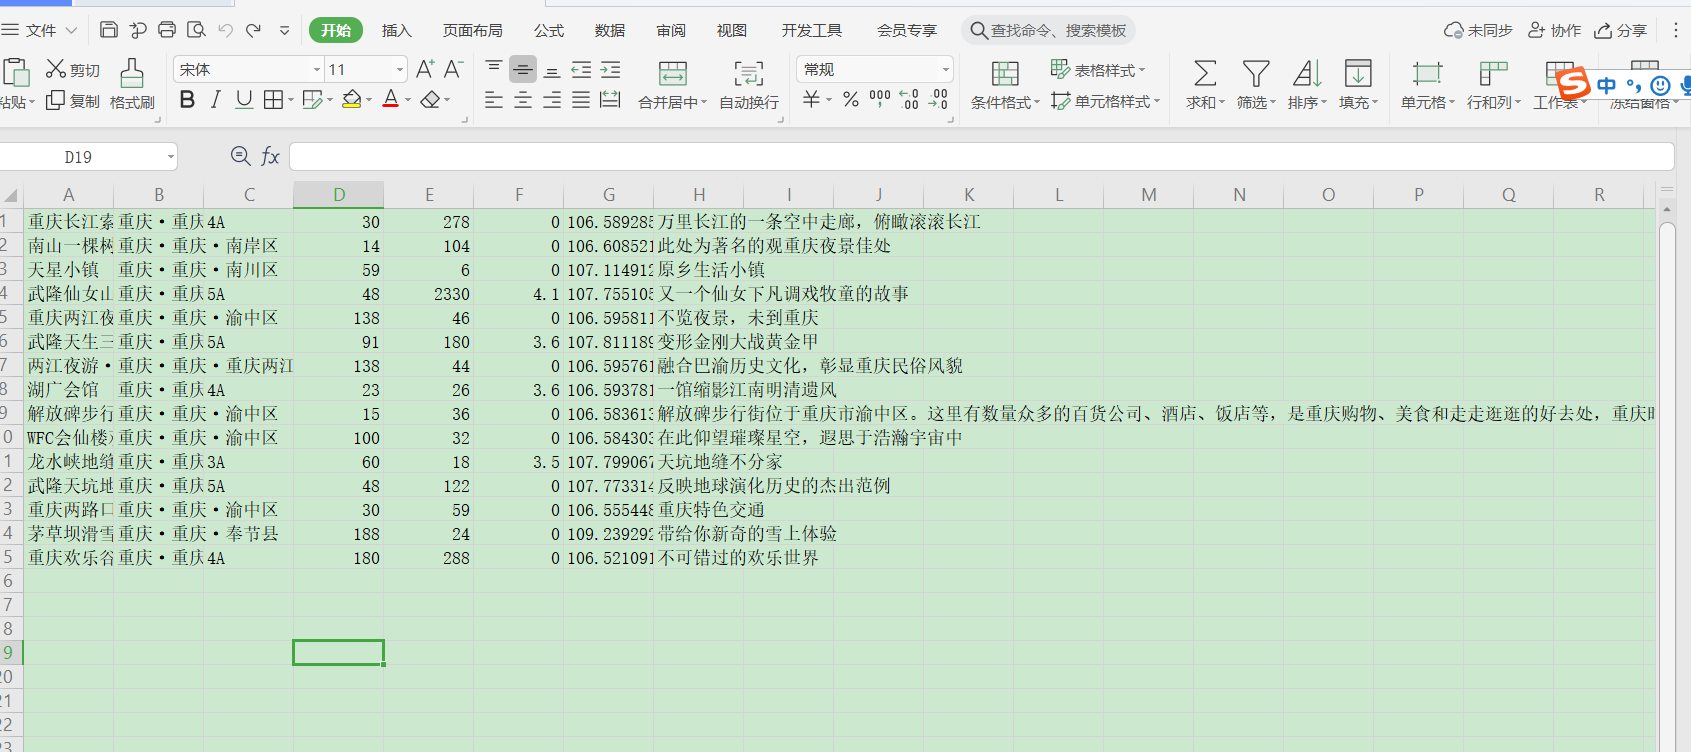
print('名稱:{0},地址:{1},星級:{2},價格:{3},saleCount:{4},評分:{5},座標:{6},介紹:{7}'.format(name,districts,star,qunarPrice,saleCount,score,point,intro))
我們需要將資料寫入表格。
import requests
import pandas as pd
import numpy as np
keyword = "重慶"
page=1#檢視第一頁
headers = {"User-Agent": "Mozilla/5.0 (Windows NT 10.0; WOW64) AppleWebKit/537.36 (KHTML, like Gecko) Chrome/69.0.3947.100 Safari/537.36"}
url = f'http://piao.qunar.com/ticket/list.json?keyword={keyword}®ion=&from=mpl_search_suggest&page={page}'
res = requests.request("GET", url, headers=headers)
res_json = res.json()
sightLists = res_json['data']['sightList']#sightList是感興趣的
for sight in sightLists:
name=(sight['sightName'] if 'sightName' in sight.keys() else None)#名稱
districts=(sight['districts'] if 'districts' in sight.keys() else None)#地址
star=(sight['star'] if 'star' in sight.keys() else None) #星級
qunarPrice=(sight['qunarPrice'] if 'qunarPrice' in sight.keys() else None)#最低價格
saleCount=(sight['saleCount'] if 'saleCount' in sight.keys() else None)#購買人數
score=(sight['score'] if 'score' in sight.keys() else None )#評分
point=(sight['point'] if 'point' in sight.keys() else None )#座標位置
intro=(sight['intro'] if 'intro' in sight.keys() else None)#介紹
#print('名稱:{0},地址:{1},星級:{2},價格:{3},saleCount:{4},評分:{5},座標:{6},介紹:{7}'.format(name,districts,star,qunarPrice,saleCount,score,point,intro))
shuju=np.array((name,districts,star,qunarPrice,saleCount,score,point,intro))
shuju=shuju.reshape(-1,8)
shuju=pd.DataFrame(shuju,columns=['名稱','地址','星級','最低價格','購買人數','評分','座標位置','介紹'])
#print(shuju)
shuju.to_csv('重慶景點資料.csv', mode='a+', index=False,header=False) # mode='a+'追加寫入
多頁爬取
前面以一頁資料為例,整理出啦大概程式碼,現在需要爬取多頁
#!/usr/bin/env python3
# -*- coding: utf-8 -*-
# @Author: yudengwu 餘登武
# @Date : 2021/1/30
import requests
import pandas as pd
import numpy as np
import random
from time import sleep
def get_data(keyword, page):
headers = {
"User-Agent": "Mozilla/5.0 (Windows NT 10.0; WOW64) AppleWebKit/537.36 (KHTML, like Gecko) Chrome/69.0.3947.100 Safari/537.36"}
url = f'http://piao.qunar.com/ticket/list.json?keyword={keyword}®ion=&from=mpl_search_suggest&page={page}'
res = requests.request("GET", url, headers=headers)
sleep(random.uniform(1, 2))
try:
res_json = res.json()
sightLists = res_json['data']['sightList'] # sightList是感興趣的
for sight in sightLists:
name = (sight['sightName'] if 'sightName' in sight.keys() else None) # 名稱
districts = (sight['districts'] if 'districts' in sight.keys() else None) # 地址
star = (sight['star'] if 'star' in sight.keys() else None) # 星級
qunarPrice = (sight['qunarPrice'] if 'qunarPrice' in sight.keys() else None) # 最低價格
saleCount = (sight['saleCount'] if 'saleCount' in sight.keys() else None) # 購買人數
score = (sight['score'] if 'score' in sight.keys() else None) # 評分
point = (sight['point'] if 'point' in sight.keys() else None) # 座標位置
intro = (sight['intro'] if 'intro' in sight.keys() else None) # 介紹
# print('名稱:{0},地址:{1},星級:{2},價格:{3},saleCount:{4},評分:{5},座標:{6},介紹:{7}'.format(name,districts,star,qunarPrice,saleCount,score,point,intro))
shuju = np.array((name, districts, star, qunarPrice, saleCount, score, point, intro))
shuju = shuju.reshape(-1, 8)
shuju = pd.DataFrame(shuju, columns=['名稱', '地址', '星級', '最低價格', '購買人數', '評分', '座標位置', '介紹'])
# print(shuju)
shuju.to_csv('重慶景點資料.csv', mode='a+', index=False, header=False) # mode='a+'追加寫入
except:
pass
if __name__ == '__main__':
keyword = "重慶"
for page in range(1, 75): # 控制頁數
print(f"正在提取第{page}頁")
sleep(random.uniform(1, 2))
get_data(keyword, page)
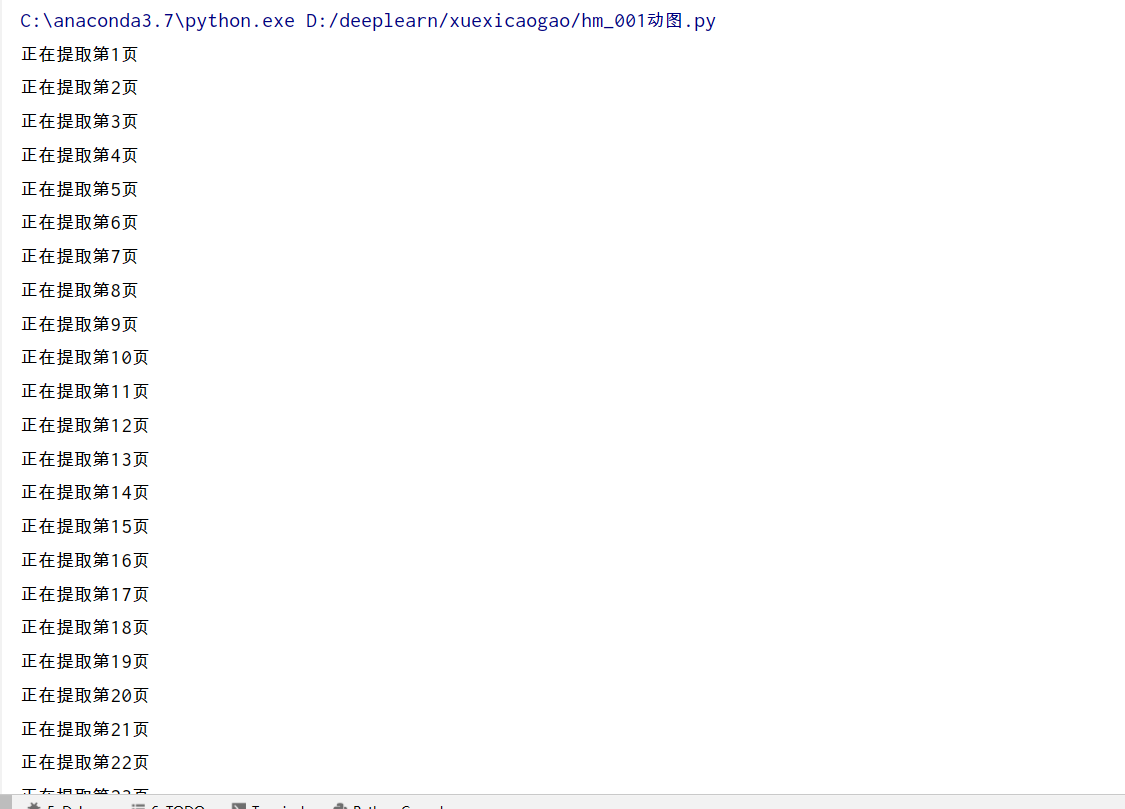 1000多條資料,原來重慶這麼多好玩的
第二部分:資料分析
前面我們爬取了資料,現在來分析下。
1.讀取資料
import pandas as pd
import numpy as np
import matplotlib.pyplot as plt
import seaborn as sns
plt.rcParams['font.sans-serif'] = ['SimHei'] # 設定載入的字型名
plt.rcParams['axes.unicode_minus'] = False#
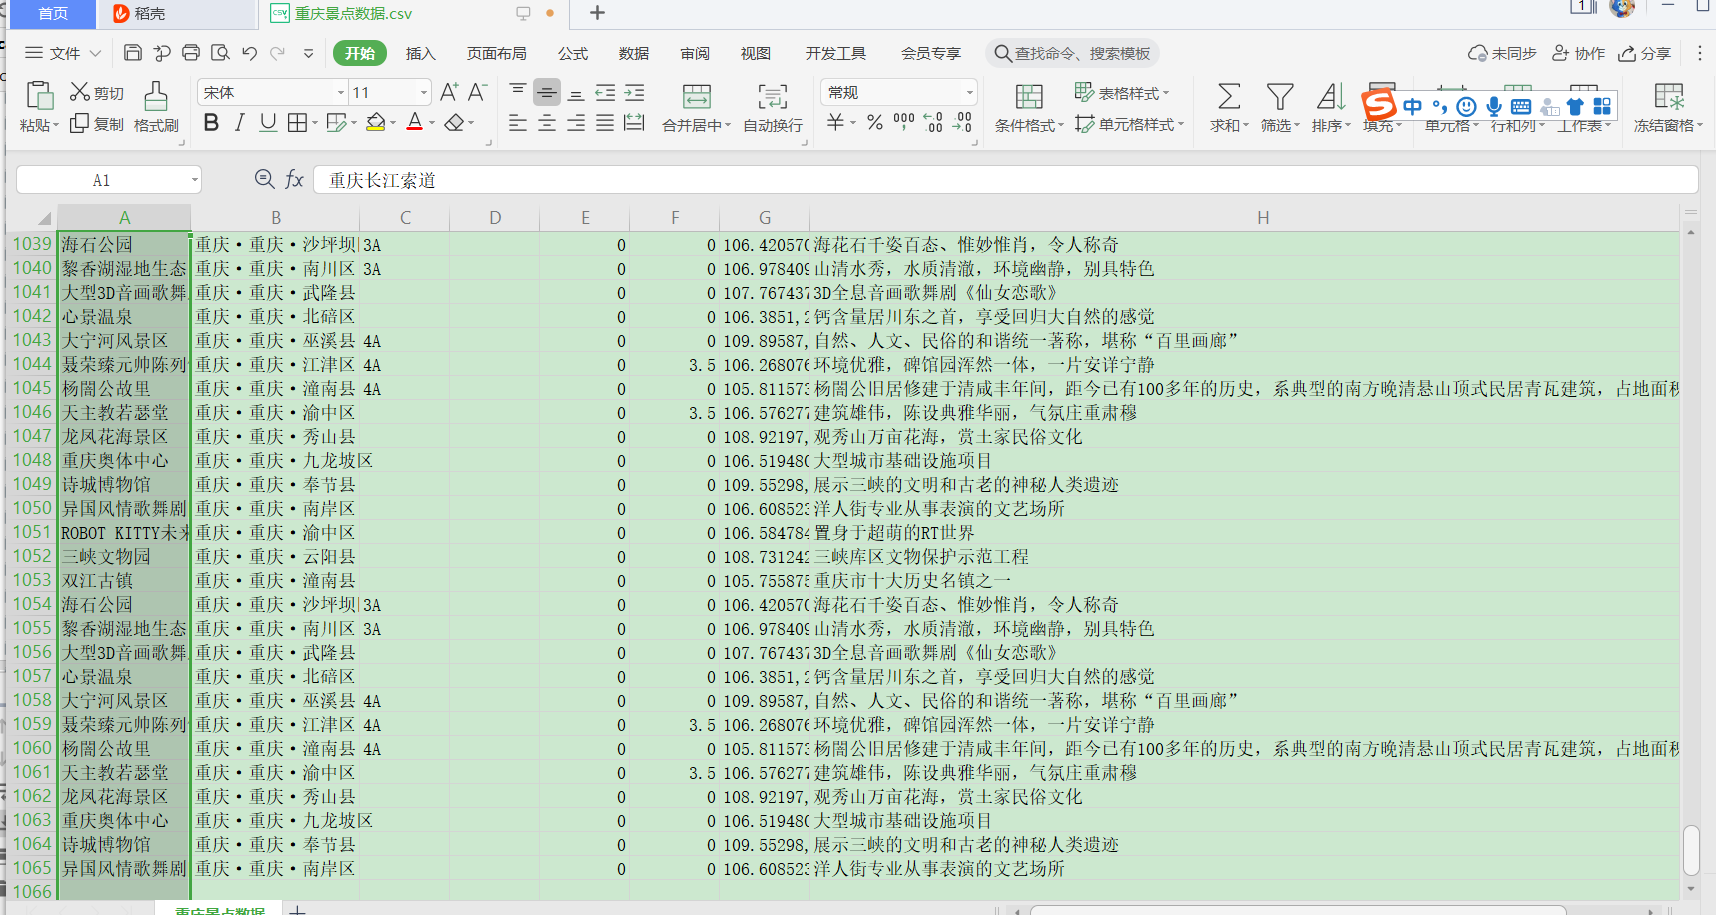
df=pd.read_csv('重慶景點資料.csv',header=None,names=list(['名稱', '地址', '星級', '最低價格', '購買人數', '評分', '座標位置', '介紹']))
df = df.drop_duplicates()#刪除重複資料。得到470行資料
print(df.head())
去除重複資料後,得到重慶有470處景點

2.景點價格分析
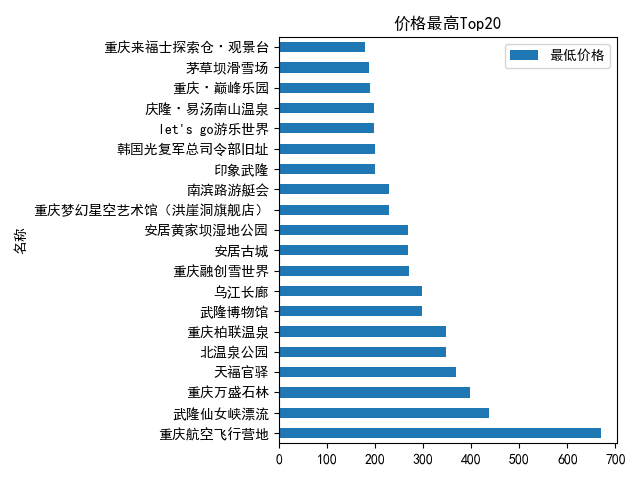
最高Top20
df_qunarPrice = df.pivot_table(index='名稱',values='最低價格')
df_qunarPrice.sort_values('最低價格',inplace=True,ascending=False)#降序
#print(df_qunarPrice[:20])#最高價格top20
df_qunarPrice[:20].plot(kind='barh')
plt.title('價格最高Top20')
plt.show()
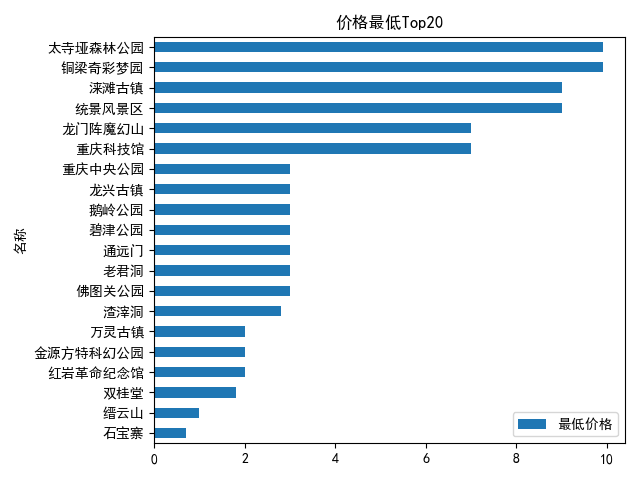
最低Top20
df_qunarPrice = df.pivot_table(index='名稱',values='最低價格')
df_qunarPrice.sort_values('最低價格',inplace=True,ascending=True)
#print(df_qunarPrice[:20])#最高價格top20
df_qunarPrice[:20].plot(kind='barh')
plt.title('最低Top20')
plt.show()
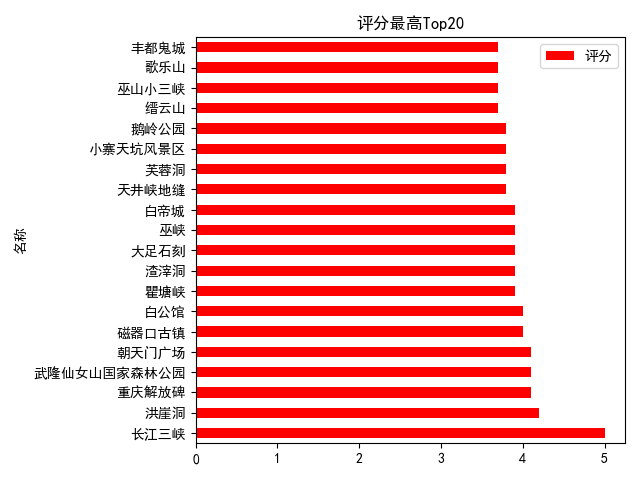
3.景點評分分析
評分最高Top20
#評分TOP20景點
df_score = df.pivot_table(index='名稱',values='評分')
df_score.sort_values('評分',inplace=True,ascending=False)
df_score[:20].plot(kind='barh',color='red')#barh橫條形圖
plt.title('評分最高Top20')
plt.show()
 評分最低Top20
df_score = df.pivot_table(index='名稱',values='評分')
df_score.sort_values('評分',inplace=True,ascending=True )
df_score[:20].plot(kind='barh',color='red')#barh橫條形圖
plt.title('評分最低Top20')
plt.show()
沒有評分(可能是網站還未收錄該地方評分吧…)

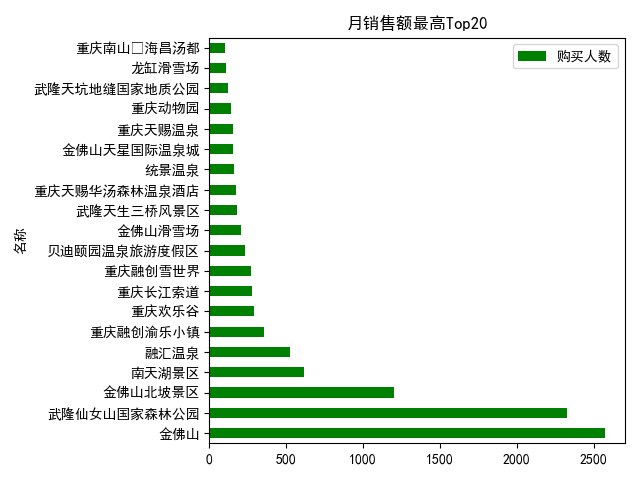
4.月銷售額分析
最高Top20
df_saleCount = df.pivot_table(index='名稱',values='購買人數')
df_saleCount.sort_values('購買人數',inplace=True,ascending=False)
df_saleCount[:20].plot(kind='barh',color='green')#barh橫條形圖
plt.title('月銷售額最高Top20')
plt.show()
最低Top20(可能未收錄該地方資料把,可能該地方免費吧)

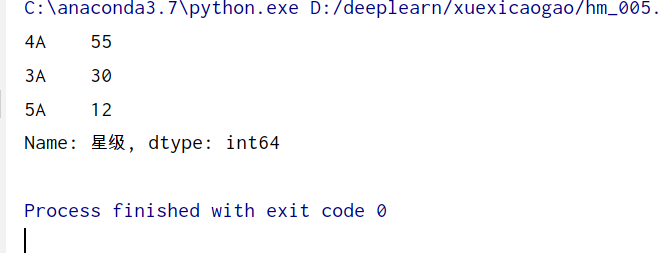
5.景點等級分佈
from pyecharts.charts import *
from pyecharts import options as opts
from pyecharts.globals import ThemeType

df_star = df["星級"].value_counts()
df_star = df_star.sort_values(ascending=False)
print(df_star)
查詢有等級的景點名稱,即3星級及其以上
print(df[df["星級"]!='無'].sort_values("星級",ascending=False)['名稱'])
展示部分圖,太多啦

6.景點地址地圖繪圖
先儲存文字地檔案
df["lon"] = df["座標位置"].str.split(",",expand=True)[0]#經度
df["lat"] = df["座標位置"].str.split(",",expand=True)[1]#緯度
df.to_csv("data重慶.csv")
繪製地圖
import pandas as pd

stations = pd.read_csv('data重慶.csv',delimiter=',')

from pyecharts.charts import Geo
from pyecharts import options
from pyecharts.globals import GeoType

g = Geo().add_schema(maptype="重慶")

# 給所有點附上標籤 'StationID'
for i in stations.index:
    s = stations.iloc[i]
    g.add_coordinate(s['名稱'],s['lon'],s['lat'])#地區名稱,經度,緯度

# 給每個點的值賦為 1
data_pair = [(stations.iloc[i]['名稱'],1) for i in stations.index]

# 畫圖
g.add('',data_pair, type_=GeoType.EFFECT_SCATTER, symbol_size=2)
g.set_series_opts(label_opts=options.LabelOpts(is_show=False))
g.set_global_opts(title_opts=options.TitleOpts(title="重慶景點分佈圖by-yudengwu"))

# 儲存結果到 html
result = g.render('stations.html')

作者:電氣-餘登武。寫作屬實不易,如果你覺得很好,動個手點個贊再走。