
Python資料分析之雙色球基於線性迴歸演算法預測
@本文來源於公眾號:csdn2299,喜歡可以關注公眾號 程式設計師學府
本文例項講述了Python資料分析之雙色球基於線性迴歸演算法預測下期中獎結果。分享給大家供大家參考,具體如下:
前面講述了關於雙色球的各種演算法,這裡將進行下期雙色球號碼的預測,想想有些小激動啊。
程式碼中使用了線性迴歸演算法,這個場景使用這個演算法,預測效果一般,各位可以考慮使用其他演算法嘗試結果。
發現之前有很多程式碼都是重複的工作,為了讓程式碼看的更優雅,定義了函式,去呼叫,頓時高大上了
    #!/usr/bin/python
    # -*- coding:UTF-8 -*-
    #匯入需要的包
    import pandas as pd
    import numpy as np
    import matplotlib.pyplot as plt
    import operator
    from sklearn import datasets,linear_model
    from sklearn.linear_model import LogisticRegression
    #讀取檔案
    df = pd.read_table('newdata.txt',header=None,sep=',')
    #讀取日期
    tdate = sorted(df.loc[:,0])
    #將以列項為資料,將球號碼取出,寫入到csv檔案中,並取50行資料
    # Function to red number to csv file
    def RedToCsv(h_num,num,csv_name):
     h_num = df.loc[:,num:num].values
     h_num = h_num[50::-1]
     renum2 = pd.DataFrame(h_num)
     renum2.to_csv(csv_name,header=None)
     fp = file(csv_name)
     s = fp.read()
     fp.close()
     a = s.split('\n')
     a.insert(0, 'numid,number')
     s = '\n'.join(a)
     fp = file(csv_name, 'w')
     fp.write(s)
     fp.close()
    #呼叫取號碼函式
    # create file
    RedToCsv('red1',1,'rednum1data.csv')
    RedToCsv('red2',2,'rednum2data.csv')
    RedToCsv('red3',3,'rednum3data.csv')
    RedToCsv('red4',4,'rednum4data.csv')
    RedToCsv('red5',5,'rednum5data.csv')
    RedToCsv('red6',6,'rednum6data.csv')
    RedToCsv('blue1',7,'bluenumdata.csv')
    #獲取資料,X_parameter為numid資料,Y_parameter為number資料
    # Function to get data
    def get_data(file_name):
     data = pd.read_csv(file_name)
     X_parameter = []
     Y_parameter = []
     for single_square_feet ,single_price_value in zip(data['numid'],data['number']):
      X_parameter.append([float(single_square_feet)])
      Y_parameter.append(float(single_price_value))
     return X_parameter,Y_parameter
    #訓練線性模型
    # Function for Fitting our data to Linear model
    def linear_model_main(X_parameters,Y_parameters,predict_value):
     # Create linear regression object
     regr = linear_model.LinearRegression()
     #regr = LogisticRegression()
     regr.fit(X_parameters, Y_parameters)
     predict_outcome = regr.predict(predict_value)
     predictions = {}
     predictions['intercept'] = regr.intercept_
     predictions['coefficient'] = regr.coef_
     predictions['predicted_value'] = predict_outcome
     return predictions
    #獲取預測結果函式
    def get_predicted_num(inputfile,num):
     X,Y = get_data(inputfile)
     predictvalue = 51
     result = linear_model_main(X,Y,predictvalue)
     print "num "+ str(num) +" Intercept value " , result['intercept']
     print "num "+ str(num) +" coefficient" , result['coefficient']
     print "num "+ str(num) +" Predicted value: ",result['predicted_value']
    #呼叫函式分別預測紅球、藍球
    get_predicted_num('rednum1data.csv',1)
    get_predicted_num('rednum2data.csv',2)
    get_predicted_num('rednum3data.csv',3)
    get_predicted_num('rednum4data.csv',4)
    get_predicted_num('rednum5data.csv',5)
    get_predicted_num('rednum6data.csv',6)
    get_predicted_num('bluenumdata.csv',1)
    # 獲取X,Y資料預測結果
    # X,Y = get_data('rednum1data.csv')
    # predictvalue = 21
    # result = linear_model_main(X,Y,predictvalue)
    # print "red num 1 Intercept value " , result['intercept']
    # print "red num 1 coefficient" , result['coefficient']
    # print "red num 1 Predicted value: ",result['predicted_value']
    # Function to show the resutls of linear fit model
    def show_linear_line(X_parameters,Y_parameters):
     # Create linear regression object
     regr = linear_model.LinearRegression()
     #regr = LogisticRegression()
     regr.fit(X_parameters, Y_parameters)
     plt.figure(figsize=(12,6),dpi=80)
     plt.legend(loc='best')
     plt.scatter(X_parameters,Y_parameters,color='blue')
     plt.plot(X_parameters,regr.predict(X_parameters),color='red',linewidth=4)
     plt.xticks(())
     plt.yticks(())
     plt.show()
    #顯示模型影象,如果需要畫圖,將“獲取X,Y資料預測結果”這塊註釋去掉,“呼叫函式分別預測紅球、藍球”這塊程式碼註釋下
    # show_linear_line(X,Y)
畫圖結果: 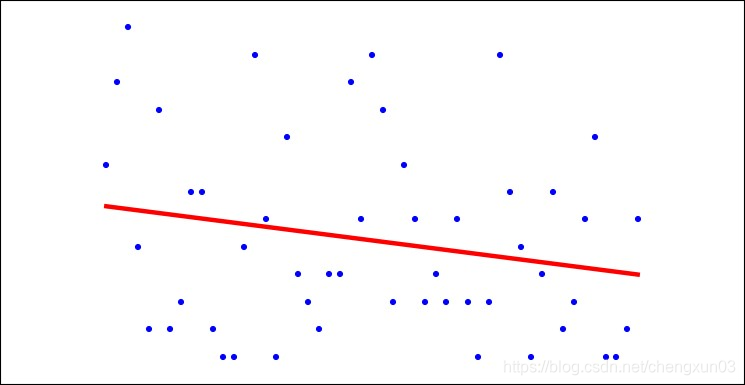
預測2016-05-15開獎結果:
實際開獎結果:
    05 06 10 16 22 26  11

    以下為預測值:#取5個數,計算的結果
    num 1 Intercept value 5.66666666667
    num 1 coefficient [-0.6]
    num 1 Predicted value: [ 2.06666667]
    num 2 Intercept value 7.33333333333
    num 2 coefficient [ 0.2]
    num 2 Predicted value: [ 8.53333333]
    num 3 Intercept value 14.619047619
    num 3 coefficient [-0.51428571]
    num 3 Predicted value: [ 11.53333333]
    num 4 Intercept value 17.7619047619
    num 4 coefficient [-0.37142857]
    num 4 Predicted value: [ 15.53333333]
    num 5 Intercept value 21.7142857143
    num 5 coefficient [ 1.11428571]
    num 5 Predicted value: [ 28.4]
    num 6 Intercept value 28.5238095238
    num 6 coefficient [ 0.65714286]
    num 6 Predicted value: [ 32.46666667]
    num 1 Intercept value 9.57142857143
    num 1 coefficient [-0.82857143]
    num 1 Predicted value: [ 4.6]
四捨五入結果:
2 9 12 16 28 33 5
    #取12個數,計算的結果四捨五入:
    3 7 12 15 24 30 7

    #取15個數,計算的結果四捨五入:
    4 7 13 15 25 31 7

    #取18個數,計算的結果四捨五入:
    4 8 13 16 23 31 8

    #取20個數,計算的結果四捨五入:
    4 7 12 22 24 27 10

    #取25個數,計算的結果四捨五入:
    7 8 13 17 24 30 6

    #取50個數,計算的結果四捨五入:
    4 10 14 18 23 29 8

    #取100個數,計算的結果四捨五入:
    5 11 15 19 24 29 8

    #取500個數,計算的結果四捨五入:
    5 10 15 20 24 29 9

    #取1000個數,計算的結果四捨五入:
    5 10 14 19 24 29 9

    #取1939個數,計算的結果四捨五入:
    5 10 14 19 24 29 9
看來預測中獎真是有些難度,隨機性太高,雙色球預測案例,只是為了讓入門資料分析的朋友有些思路,要想中大獎還是有難度的,多做好事善事多積德行善吧。
非常感謝你的閱讀
大學的時候選擇了自學python,工作了發現吃了計算機基礎不好的虧,學歷不行這是
沒辦法的事,只能後天彌補,於是在編碼之外開啟了自己的逆襲之路,不斷的學習python核心知識,深入的研習計算機基礎知識,整理好了,如果你也不甘平庸,那就與我一起在編碼之外,不斷成長吧!
其實這裡不僅有技術,更有那些技術之外的東西,比如,如何做一個精緻的程式設計師,而不是“屌絲”,程式設計師本身就是高貴的一種存在啊,難道不是嗎? [ [點選加入]
](https://jq.qq.com/?_wv=1027&k=5ipV5It) 想做你自己想成為高尚人,加油!