java.exe進程來源排查錄
阿新 • • 發佈:2017-05-20
con http mman lvm cor 情況 ted sent oca 
解決後的一個小結:
此處是一個tomcat端口,這種情況下,可以先在瀏覽器訪問下看看效果,就可以快速定位
下面的定位過程,適用於各種場合
無意中發現有個進程開了好多端口,很奇怪
看看這個java.exe的啟動參數:jinfo
64位環境:jinfo -J-d64 pid

The jinfo command prints Java configuration information for a specified Java process or core file or a remote debug server.
The configuration information includes Java system properties and Java Virtual Machine (JVM) command-line flags.
If the specified process is running on a 64-bit JVM, then you might need to specify the -J-d64 option,
for example: jinfo -J-d64 -sysprops pid.
This utility is unsupported and might not be available in future releases of the JDK.
In Windows Systems where dbgeng.dll is not present, Debugging Tools For Windows must be installed to have these tools working.
The PATH environment variable should contain the location of the jvm.dll
that is used by the target process or the location from which the crash dump file was produced.
For example, set PATH=%JDK_HOME%\jre\bin\client;%PATH% .
http://docs.oracle.com/javase/8/docs/technotes/tools/unix/jinfo.html
有一個奇怪的地方jps、jconsole.exe和jvisualvm.exe中都看不到4036的進程


最後通過procexp64.exe來查看
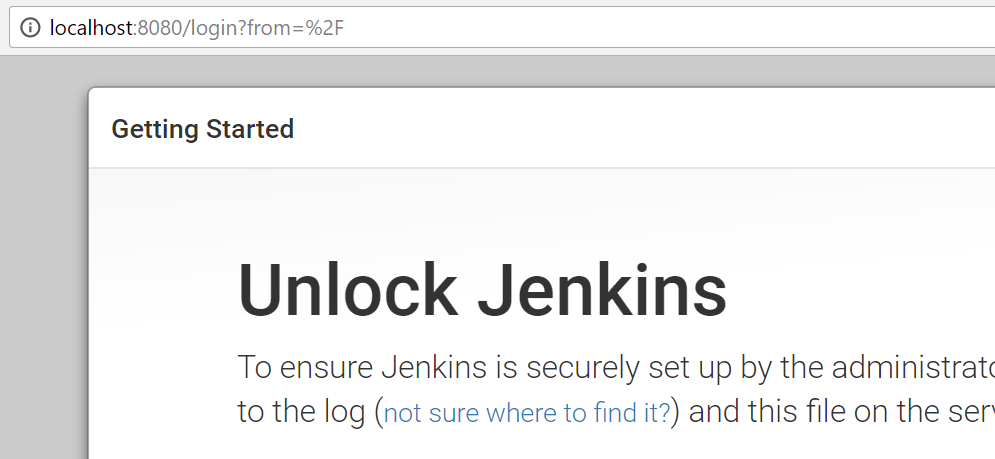
原來是Jenkins,有瀏覽器訪問下看看:
java.exe進程來源排查錄
