
Phpstorm-Xdebug配置
用的是phpstudy集成開發環境
1 xdebug關於Php.ini配置最後寫上
php5的
[XDebug]
xdebug.profiler_append = 0
xdebug.profiler_enable = 1
xdebug.profiler_enable_trigger = 0
xdebug.profiler_output_dir="D:\phpStudy\tmp\xdebug"
xdebug.profiler_output_name = "cachegrind.out.%t-%s"
xdebug.remote_enable = 1
xdebug.remote_handler = dbgp
xdebug.remote_host= localhost
xdebug.remote_port = 9000
xdebug.trace_output_dir="D:\phpStudy\tmp\xdebug"
zend_extension="D:\phpStudy\php\php-5.5.38\ext\php_xdebug.dll"
xdebug.idekey= PHPSTROM
===============
php7
[XDebug]
xdebug.profiler_append = 0
xdebug.profiler_enable = 1
xdebug.profiler_enable_trigger = 0
xdebug.profiler_output_dir="D:\phpStudy\tmp\xdebug"
xdebug.profiler_output_name = "cachegrind.out.%t-%s"
xdebug.remote_enable = 1
xdebug.remote_handler = dbgp
xdebug.remote_host= localhost
xdebug.remote_port = 9000
xdebug.trace_output_dir="D:\phpStudy\tmp\xdebug"
zend_extension="D:\phpStudy\php\php-7.0.12-nts\ext\php_xdebug.dll"
xdebug.idekey= PHPSTROM
記得開啟擴展
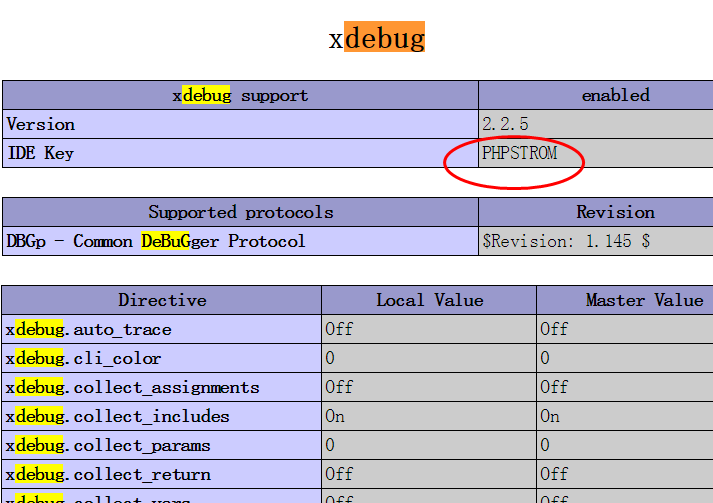
2 xdebug的配置和php.ini一致
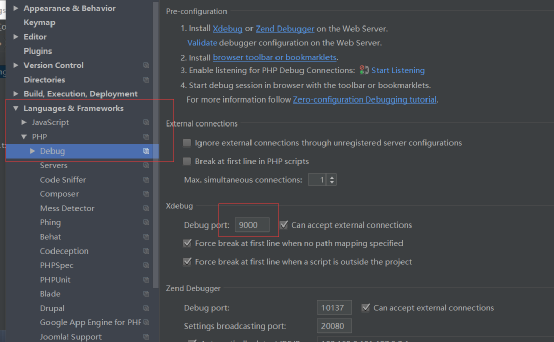
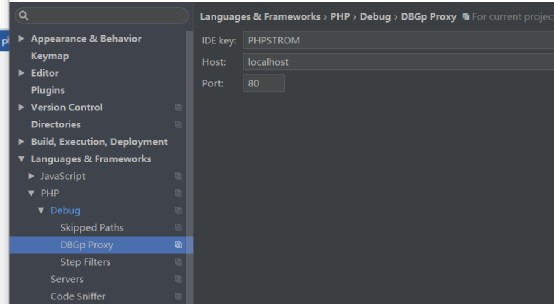
3 xdebug的DBGp配置默認的這些
3. xdebug的配置服務2鐘方式
一種是在右上角按 配置
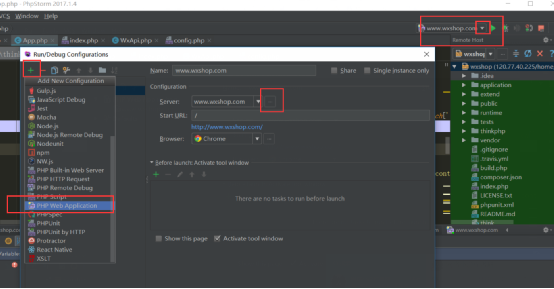
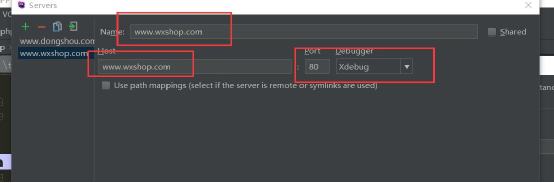

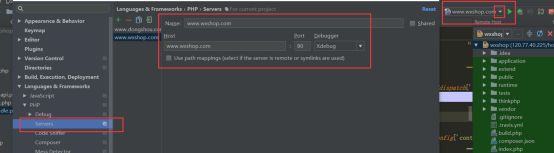
一種是直接在配置裏面設置
配置chrom的debug(參考)
http://download.csdn.net/detail/erisern2/9470496
4 xdebug最後
選好右上角的配置,然後設置斷點,斷點記得一定要選好位置,不要選在空白處,不然無法啟動,選在類,函數開頭,或者變量位置!!!!!!!!!!!!!!!!!!!啟動小蜘蛛就可以了
多個配置則添加多個PHP web Application即可,配置完畢!!
Phpstorm-Xdebug配置