
《DSP using MATLAB》Problem 2.8
阿新 • • 發佈:2017-12-06
for logs inpu present matlab printf 坐標 seq alt
1、代碼:
從MATLAB官方網上下載的。
%*************************************************************************%
%A code for the Downsampler%
%Author: Yashwant Marathe%
%Date:20-12-2010%
function [y ny] = dnsample(x,n,M)
%x is a sequence over indices specified by vector n,M is the downsampling factor.

param=n/M;
%generates the parameter vector.This vector will decide which input samples will be present in the output.

samp=fix(param)==param;
%only those output vectors corresponding to indices where samp==1 will be present in the output.

y=x(samp==1);
%generates the output sequence

ny=n(samp==1)/M;
%generates the indices of the output sequence

end
%**************************************************************************
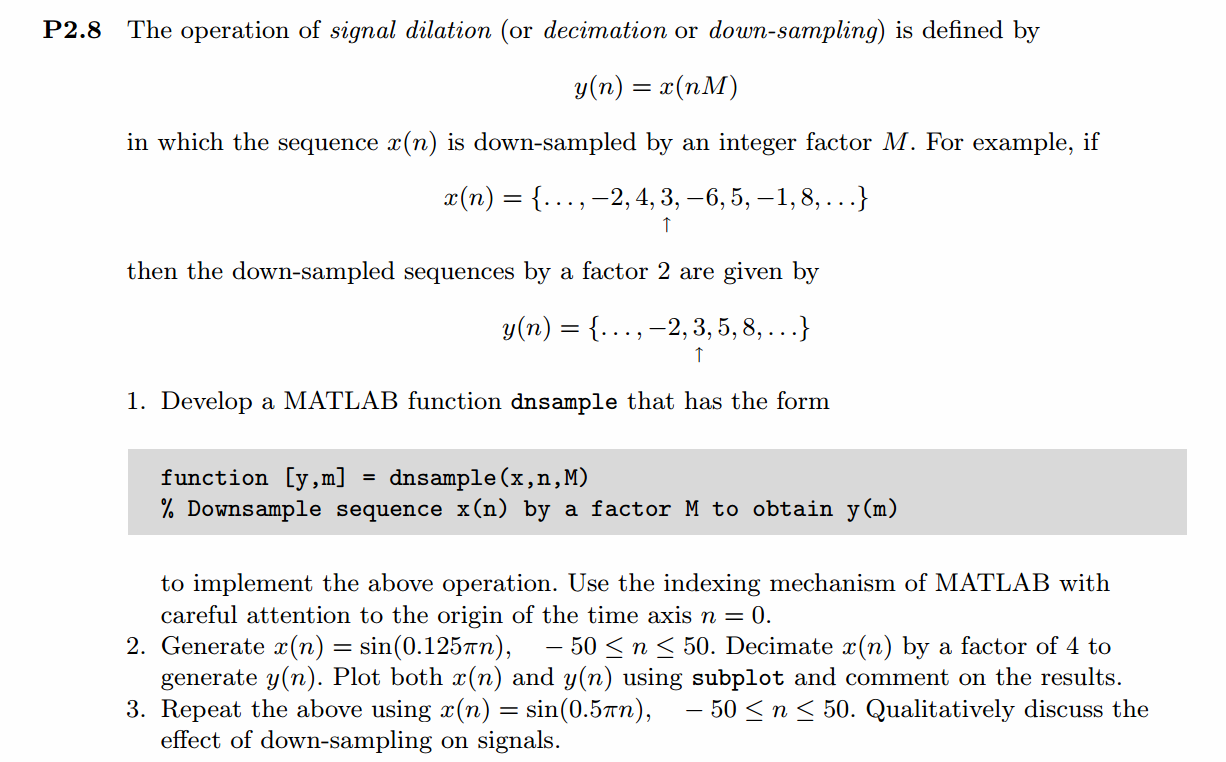
2、代碼
%% ------------------------------------------------------------------------
%%            Output Info about this m-file
fprintf(‘\n***********************************************************\n‘);
fprintf(‘        <DSP using MATLAB> Problem 2.8.2 \n\n‘);

banner();
%% ------------------------------------------------------------------------

n = [-50:1:50];
x = sin( 0.125 * pi * n );

M = 4;

[y, m] = dnsample(x, n, M);


figure(‘NumberTitle‘, ‘off‘, ‘Name‘, ‘Problem 2.8.2‘)
set(gcf,‘Color‘,[1,1,1])                  % 改變坐標外圍背景顏色

subplot(2,1,1); stem(n, x); title(‘x sequence‘);
xlabel(‘n‘); ylabel(‘x(n)‘) ;
grid on
subplot(2,1,2); stem(m, y); title(‘y sequence‘);
xlabel(‘n‘); ylabel(‘y(m)‘);
grid on;
運行結果:
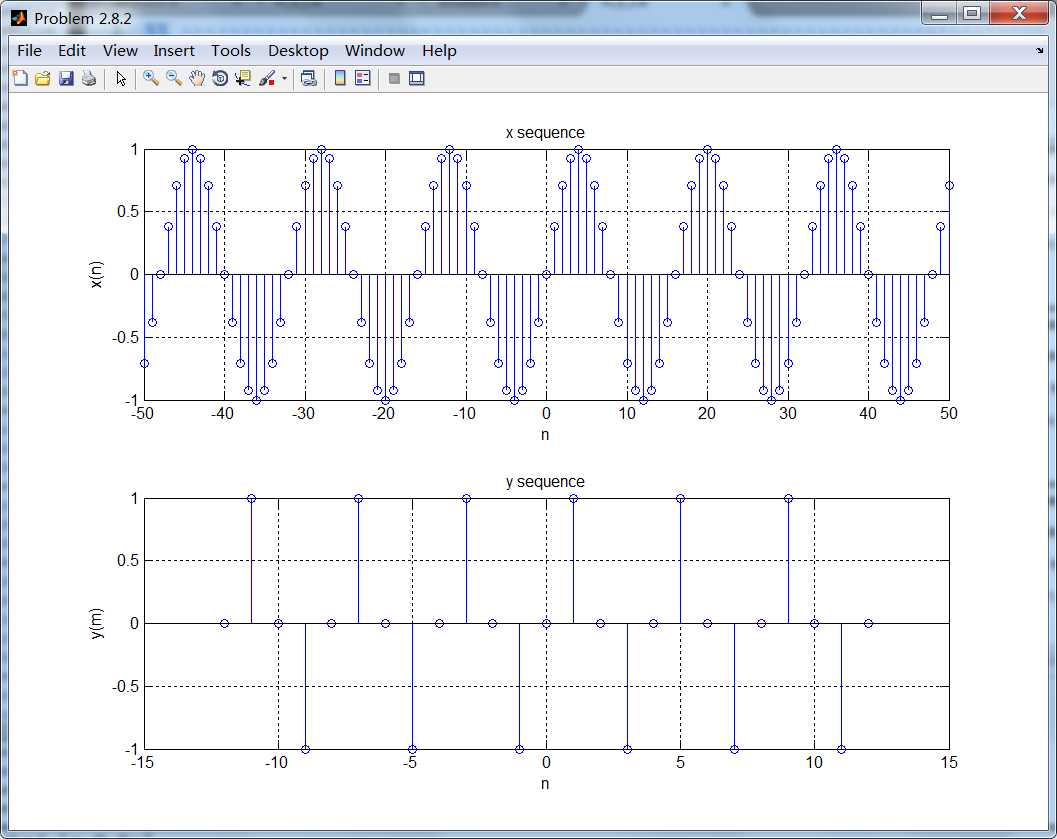
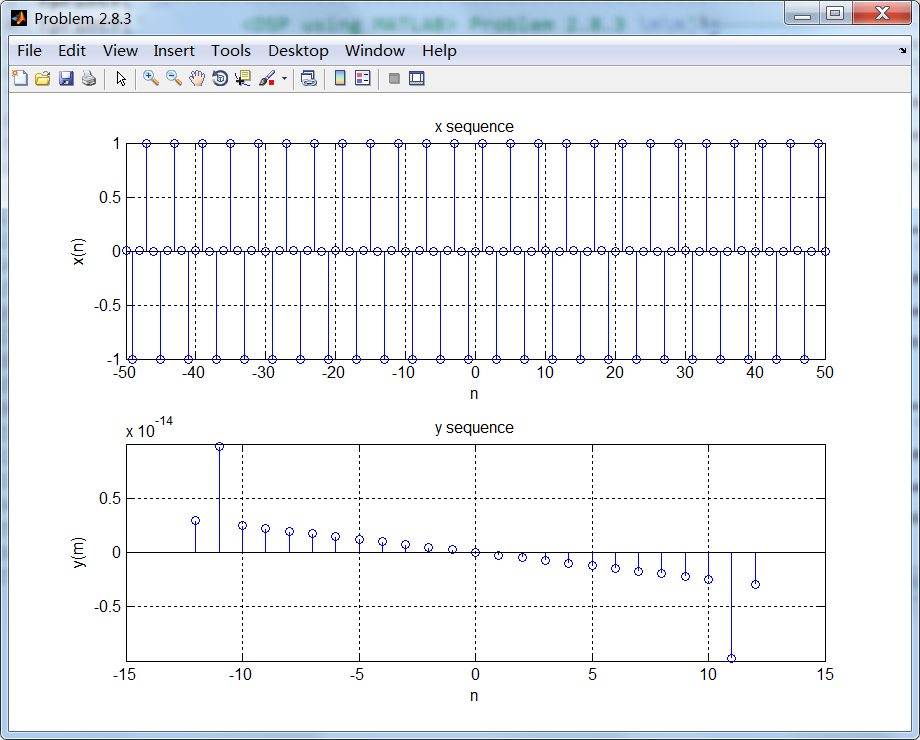
3、代碼
%% ------------------------------------------------------------------------
%%            Output Info about this m-file
fprintf(‘\n***********************************************************\n‘);
fprintf(‘        <DSP using MATLAB> Problem 2.8.3 \n\n‘);

banner();
%% ------------------------------------------------------------------------

n = [-50:1:50];
x = sin( 0.5 * pi * n );

M = 4;

[y, m] = dnsample(x, n, M);


figure(‘NumberTitle‘, ‘off‘, ‘Name‘, ‘Problem 2.8.3‘)
set(gcf,‘Color‘,[1,1,1])                  % 改變坐標外圍背景顏色

subplot(2,1,1); stem(n, x); title(‘x sequence‘);
xlabel(‘n‘); ylabel(‘x(n)‘) ;
grid on
subplot(2,1,2); stem(m, y); title(‘y sequence‘);
xlabel(‘n‘); ylabel(‘y(m)‘);
grid on;
運行結果:
《DSP using MATLAB》Problem 2.8