R語言社區主題檢測算法應用
使用R檢測相關主題的社區

創建主題網絡
對於Project Mosaic,我正在通過分析抽象文本和共同作者社交網絡來研究UNCC在社會科學和計算機和信息學方面的出版物。
我遇到的一個問題是:如何衡量主題之間的關系(相關性)?特別是,我想創建一個連接類似主題的網絡可視化,並幫助用戶更輕松地瀏覽大量主題(在本例中為100個主題)。
在本教程中,我通過組合來自兩個非常棒的資源的代碼來實現這一目標:
- Tyler Rinker的主題建模回購(參見“關於主題的詞語分布的網絡”)
- Katherine Ognyanova的網絡可視化教程。
數據準備
我們的第一步是加載作為LDA輸出的主題矩陣。LDA有兩個輸出:字主題矩陣和文檔主題矩陣。在本教程中,我上傳了以前保存為平面(csv)文件的已保存LDA結果。
作為加載平面文件的替代方法,您可以使用topicmodels包lda函數的輸出來創建任何單詞主題和文檔主題矩陣。獲取函數的輸出並在輸出上lda運行該posterior函數。
# load in author-topic matrix, first column is word
author.topic <- read.csv("./author_topics.csv", stringsAsFactors = F)
# load in word-topic matrix, first column is word
top.words <- word.topics[order(-word.topic[,i])]
name$topic_name[i] <- paste(top.words[1:5], collapse = " + ")
}
# rename topics
colnames(author.topic) <- c("author_name",name$topic_name)
與摘要是文檔的標準LDA不同,我運行了一個“以作者為中心”的LDA,其中所有作者的摘要被合並並被視為每個作者的一個文檔。我跑這是因為我的最終目標是使用主題建模作為信息檢索過程來確定研究人員的專業知識。
創建靜態網絡
在下一步中,我使用每個主題的單詞概率之間的相關性創建一個網絡。
首先,我決定只保留具有顯著相關性(20%+相關性)的關系(邊緣)。我使用20%,因為它對於100個觀察維基百科的樣本具有0.05的統計顯著性水平。
cor_threshold <- .2
接下來,我們使用相關矩陣來創建igraph數據結構,刪除所有具有小於20%最小閾值相關性的邊。
library(igraph)
讓我們繪制一個簡單的igraph網絡。
par(mar=c(0, 0, 3, 0))
y30")
title("Strength Between Topics Based On Word Probabilities", cex.main=.8)

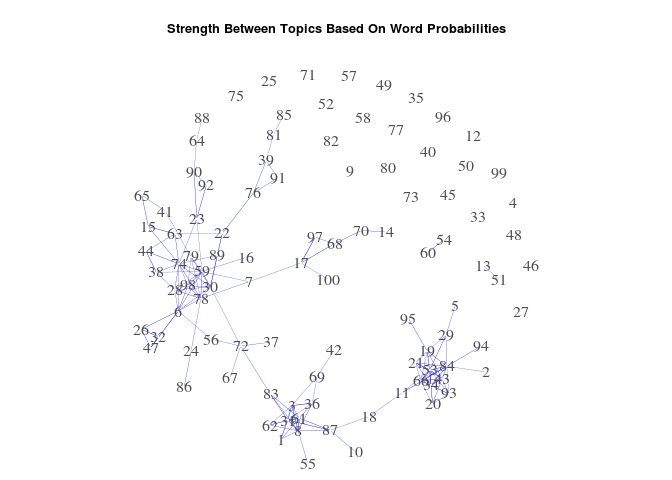
每個數字代表一個主題,每個主題都有編號以識別它。
我的第一個觀察是,似乎有三個主要的集群。
讓我們使用社區檢測,特別是igraph中的標簽傳播算法來確定網絡中的群集。
clp <- cluster_label_prop(graph)
class(clp)
title("Community Detection in Topic Network", cex.main=.8)

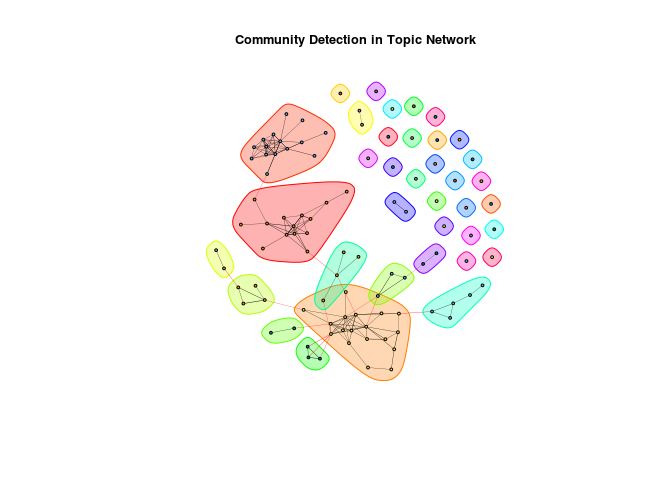
社區檢測發現了13個社區,以及每個孤立主題的多個額外社區(即沒有任何聯系的主題)。
與我最初的觀察結果類似,該算法找到了我們在第一個圖中識別的三個主要聚類,但也添加了其他較小的聚類,這些聚類似乎不適合三個主要聚類中的任何一個。
讓我們保存我們的社區,並計算我們將在下一部分使用的學位中心性和中介性。
V(graph)$community <- clp$membership
V(graph)$degree <- degree(graph, v = V(graph))
動態可視化
在本節中,我們將使用visNetwork允許R中的交互式網絡圖的包。
首先,讓我們調用庫並運行visIgraph一個交互式網絡,但是使用igraph圖形設置在igraph結構(圖形)上運行。
library(visNetwork)
這是一個良好的開端,但我們需要有關網絡的更多詳細信息。
讓我們通過創建visNetwork數據結構走另一條路。為此,我們將igraph結構轉換為visNetwork數據結構,然後將列表分成兩個數據幀:節點和邊緣。
data <- toVisNetworkData(graph)
nodes <- data[[1]]
刪除沒有連接的節點(主題)(度= 0)。
nodes <- nodes[nodes$degree != 0,]
讓我們添加顏色和其他網絡參數來改善我們的網絡。
library(RColorBrewer)
col <- brewer.pal(12, "Set3")[as.factor(nodes$community)]
nodes$shape <- "dot"
s$betweenness))+.2)*20 # Node size
nodes$color.highlight.background <- "orange"
最後,讓我們用交互式情節創建我們的網絡。您可以使用鼠標滾輪進行縮放。
visNetwork(nodes, edges) %>%
visOptions(highlightNearest = TRUE, selectedBy = "community", nodesIdSelection = TRUE)
按ID選擇
學生+規模+項目+有效性+過程
糖尿病+卡羅萊納州+北卡羅來納州+教育+北方
教師+數學+學校+小學+學生
地位+女性+性別+個人+理論
數據+跟蹤+動作+分類+視頻
物種+數據+序列+病例+遺傳
學生+學校+學校+幹+成就
victimization + criminal + victims + rates + violence
older + aging + adults + successful + older_adults
joint + control + controls + balance + lateral
protein + flexibility + properties + structure + families
security + system + configuration + attacks + smart
mobile + information + application + search + data
genes + gene + expression + genetic + genome
energy + intervention + data + hypertension + dietary
health + patients + hospitals + racial + rate
providers + work + care + hiv + violence
health + ability + cognitive + outcomes + factors
power + users + information + user + systems
spatial + urban + location + geographic + information
public + organizations + data + evaluation + program
framework + image + images + retrieval + features
data + systems + problem + scheme + key
women + ci + pregnancy + health + odds
visual + data + problem + analytics + events
students + instruction + disabilities + skills + literacy
image + images + visual + algorithm + object
health + care + smoking + current + data
technology + teacher + learning + teachers + chapter
systems + agents + complex + agent + control
routing + network + networks + topology + nodes
social + issues + gender + challenges + perceptions
knowledge + software + management + important + effective
members + team + virtual + teams + diversity
health + care + community + primary + primary_care
network + networks + addresses + techniques + novel
images + flow + image + building + tracking
stress + exercise + function. + age + n
health + women + care + cognitive + united
meetings + meeting + organizational + work + job
reading + schools + implementation + behavior + academic
continuum + objects + robot + object + motion
data + plans + finally + online + plan
workplace + organizational + work + temporal + workers
students + learning + course + computing + student
transition + practices + program + students + evidence.based
attacks + security + system + mechanism + protocol
urban + charlotte + economic + cities + areas
security + developers + vulnerabilities + software + secure
health + children + care + areas + florida
virtual + environment + children + technique + user
genomes + binding + genes + sites + similar
early + development + literacy + professional + childhood
structural + binding + tranion + protein + structures
agents + navigation + game + data + world
visualization + time + data + network + security
users + policy + user + access + social
data + time + factors + provide + variables
design + data + understanding + process + issues
information + risk + real + process + social
game + students + games + educational + student
health + physical + older + african + americans
firms + value + financial + information + accounting
public + environmental + commitment + values + industry
students + intervention + alcohol + college + drinking
development + housing + prices + economic + offers
novel + insight + visual + evaluation + text
land + data + urban + lidar + spatial
graph + privacy + database + social + theoretical
spatial + parallel + computing + modeling + data
youth + services + children + child + family
activity + physical + physical_activity + running + strains
patients + patient + costs + care + outcomes
genes + splicing + alternative + rna.seq + gene
data + values + applied + peak + mass
array + expression + microarray + de + probe
Select by community
首先,請註意有兩個下拉菜單。第一個下拉列表允許您按名稱查找任何主題(按單詞概率排名前五個單詞)。
第二個下拉列表突出顯示了我們算法中檢測到的社區。玩這個菜單。使用主題名稱(使用鼠標滾動放大),您能解釋主題社區似乎是什麽嗎?
最大的三個似乎是:
- 計算(灰色,簇4)
- 社交(綠藍,群集1)
- 健康(黃色,群集2)
檢測到的較小社區有什麽獨特之處?你能解釋一下嗎?
最後,泡沫的大小基於網絡(中心)度量中介。這可以衡量該節點對整個網絡連接的重要性。在此示例中,較大的節點具有較高的中介性,這意味著主題在跨主題群集時更為重要。
哪個是最大的節點?這些主題是保持網絡連接的“粘合劑”。什麽resesarch概念可能會將這些主題與社區之外的主題聯系起來?

R語言社區主題檢測算法應用
