numpy 用於影象處理
阿新 • • 發佈:2018-11-02
1. 轉換為灰度圖
灰度圖的資料可以看成是二維陣列,元素取值為0 ~ 255,其中,0為黑色,255為白色。從0到255逐漸由暗色變為亮色。
灰度圖轉換(ITU-R 601-2亮度變換):
L = R * 299 / 1000 + G * 587 / 1000 + B * 114 / 1000
R,G,B為最低維的資料。
顯示灰度圖時,需要在imshow中使用引數:
cmap="gray"
import numpy as np
import cv2
import matplotlib.pyplot as plt
from PIL import Image
import numpy as np def get_color_channels(img): img = img.copy() channels_num = len(img.shape) result = [] channels = np.split(img, channels_num, axis=2) for i in channels: result.append(i.sum(axis=2)) return result
# img = cv2.imread('/home/geoffrey/圖片/小熊貓.png')
img = Image.open('/home/geoffrey/圖片/小熊貓.jpeg')
img = np.array(img)
# img.transpose(0,1,2)
plt.imshow(img)
plt.show()
img.shape(559, 700, 3)R, G, B, = get_color_channels(img)R.shape(559, 700)w = np.ones((500,500,3))
plt.imshow(w)
plt.show()
w = np.zeros(shape=(500,500,3), dtype=np.uint8)
plt.imshow(w)
plt.show()

w = np.full(shape=(500,500,3), fill_value=125 , dtype=np.uint8)
w[:] = [0,238,225] # 廣播操作
plt.imshow(w)
plt.show()
L = R * 299 / 1000 + G * 587 / 1000 + B * 114 / 1000
plt.imshow(L, cmap="gray")
plt.show()
temp = np.array([ 0.299,  0.587, 0.114])
plt.imshow([email protected], cmap="gray")
plt.show()
w = np.zeros(shape=(500,500,3), dtype=np.uint8)
plt.imshow(w)
plt.show()

plt.imshow(L.T, cmap="gray")
plt.show()
test1 = np.array([
    [1,0],
    [0,1]
])
# img.transpose(0,1,2)
plt.imshow(img)
plt.show()
B_img = img.copy()
B_img[:,:, [0,1]]=0

R_img = img.copy()
R_img[:,:, [0,2]]=0

G_img = img.copy()
G_img[:,:, [2,1]]=0
fig,ax = plt.subplots(2,2)
#
ax[0,0].imshow(img)
ax[1,1].imshow(R_img)
ax[1,0].imshow(G_img)
ax[0,1].imshow(B_img)
fig.set_size_inches(15, 15)
plt.tight_layout()
plt.show()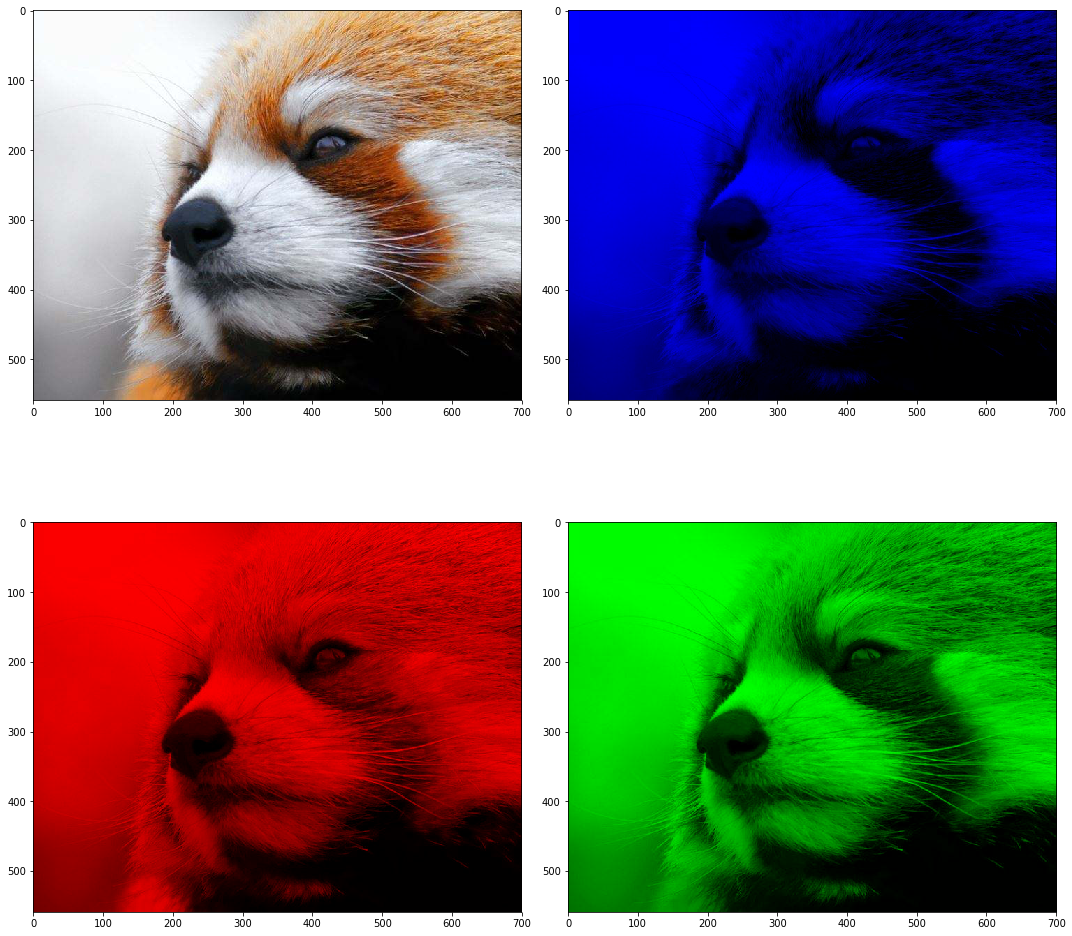
t1 = np.concatenate((img, img, img), axis=1) # 橫向拼接
t2 = np.concatenate((t1, t1), axis=0)

plt.imshow(t2)
plt.show()
水平映象 --- 交換行
mirrow_img_x = img[::-1]
plt.imshow(mirrow_img_x)
plt.show()
水平翻轉 --- 交換列
mirrow_img_y = img[:,::-1]
plt.imshow(mirrow_img_y)
plt.show()
調換x,y座標
plt.imshow(img.transpose(1,0,2))
plt.show()
plt.imshow(img.transpose(1,0,2)[::-1])
plt.show()
test = img[:, :, [2,1,0]]
plt.imshow(test)
plt.show()
k = np.random.randint(0, 256, size=(200, 200, 3), dtype=np.uint8)
test = img.copy()
test[300:500,400:600] = k
plt.imshow(test)
plt.show()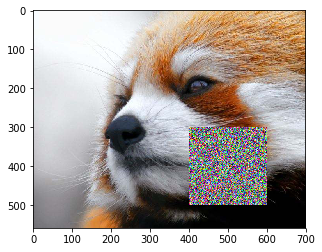
t = img.copy()
height=t.shape[0]

li = np.split(t, range(100, height, 30), axis=0)
np.random.shuffle(li)
t = np.concatenate(li, axis=0)
plt.imshow(t)
plt.show()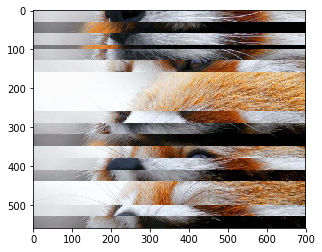
t = img.copy()

plt.imshow(t[:,:,[2,0,1]])
plt.show()