第七次作業--numpy統計分佈顯示
阿新 • • 發佈:2018-11-10
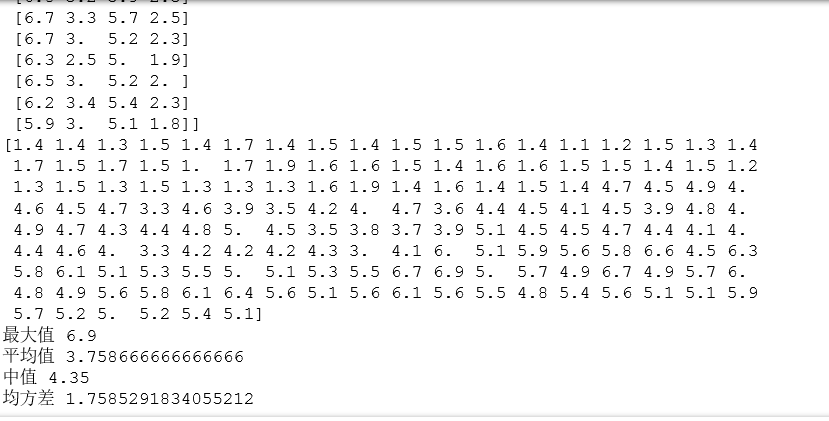
計算鳶尾花花瓣長度的最大值,平均值,中值,均方差。
import numpy as np from sklearn.datasets import load_iris data=load_iris() print(type(data)) print(data.keys(),data.feature_names) iris=data.data print(iris) petal_length=iris[:,2] print(petal_length) print("鳶尾花花瓣長度的最大值",np.max(petal_length)) print("鳶尾花花瓣長度的平均值",np.mean(petal_length))print("鳶尾花花瓣長度的中值",np.median(petal_length)) print("鳶尾花花瓣長度的均方差",np.std(petal_length))
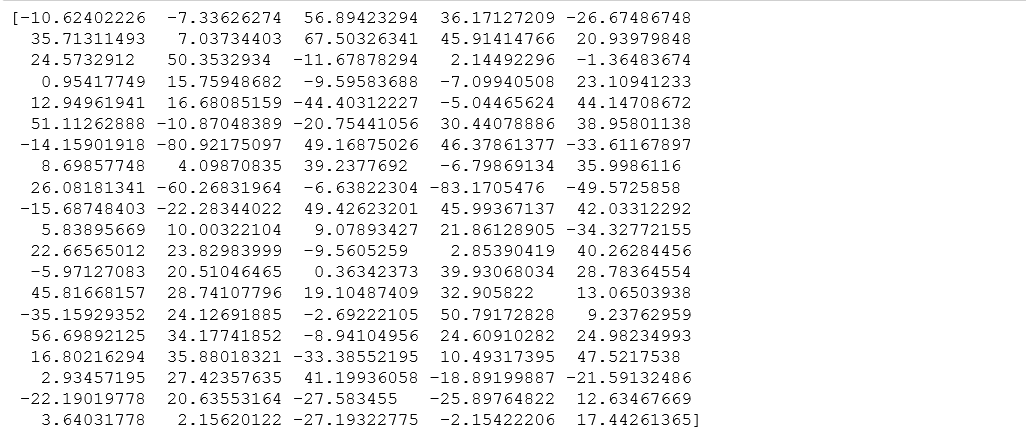
用np.random.normal()產生一個正態分佈的隨機陣列,並顯示出來。
import numpy as np

mu = 10  #期望為10
sigma = 30  #標準差為30
num = 100  #個數為100

rand_data = np.random.normal(mu, sigma, num)
print(rand_data)
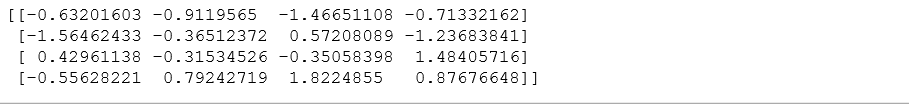
np.random.randn()產生一個正態分佈的隨機陣列,並顯示出來。
import numpy as np
a=np.random.randn(4,4) #4行4列的正態分佈隨機陣列
print(a)
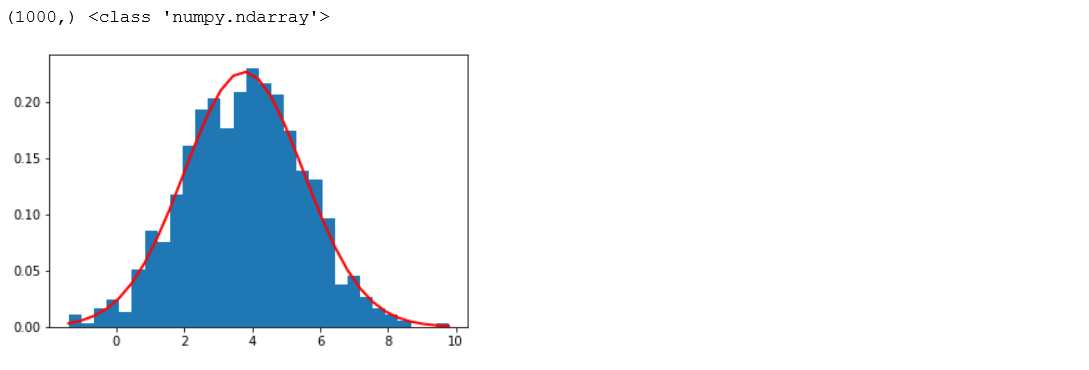
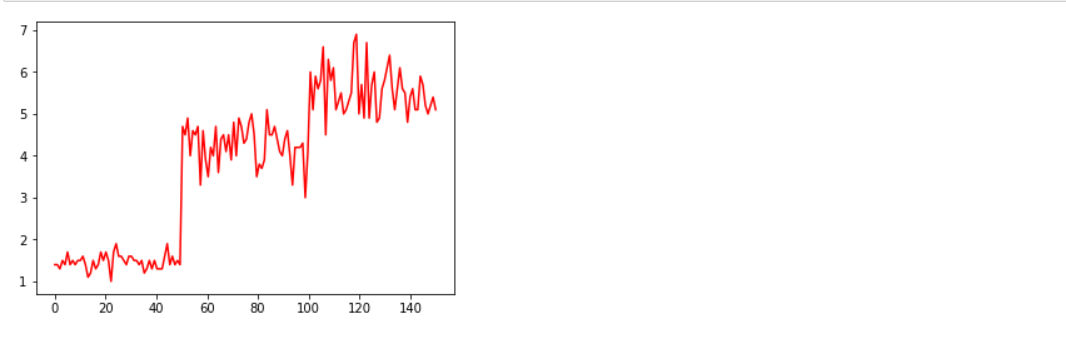
顯示鳶尾花花瓣長度的正態分佈圖,曲線圖,散點圖。
#顯示鳶尾花花瓣長度的正態分佈圖 import numpy as np import matplotlib.pyplot as plt mu = np.mean(petal_length) #花瓣長度的期望值 sigma = np.std(petal_length) #花瓣長度的標準差num = 1000 #花瓣個數 rand_data = np.random.normal(mu, sigma, num) print(rand_data.shape,type(rand_data)) count, bins, ignored = plt.hist(rand_data, 30, normed=True) plt.plot(bins, 1/(sigma * np.sqrt(2 * np.pi)) *np.exp( - (bins - mu)**2 / (2 * sigma**2)), linewidth=2, color='r') plt.show()
#顯示鳶尾花花瓣長度的正態曲線圖
plt.plot(np.linspace(0,150,num=150),petal_length,'r')
plt.show()
#顯示鳶尾花花瓣長度的散點圖
import numpy as np
import matplotlib.pyplot as plt
plt.scatter(np.linspace(0,150,num=150),petal_length,alpha=0.5,marker='x',color='b')
plt.show()