
Linux繪圖工具gnuplot基本操作
阿新 • • 發佈:2018-11-10
1.gnuplot的安裝
sudo apt-get install gnuplot
sudo apt-get install gnuplot-x11
2.測試使用
輸入
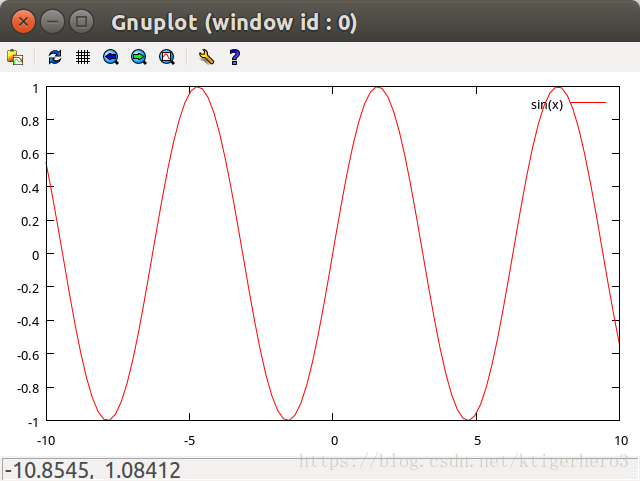
gnuplot出現命令列,輸入
plot sin(x)畫一條正弦曲線
如圖
3.繪製的圖形儲存和檢視
(1)設定儲存的圖形型別為eps
set term post eps儲存為pdf格式
set term pdfcairo儲存為png格式
set term pngcairo(2)設定儲存的檔名
set output “test.eps”
(3)畫曲線圖形
plot sin(x)此時不會彈出視窗
(4)點選test.eps就直接能夠開啟查看了(注意用一個 postscript 檢視器/印表機就可以檢視生成的檔案,ubantu自帶的影象檢視器也可以開啟)
4.載入檔案並畫圖
(1)在testdata.txt中加入以下內容,表示有三個點
0 0
1 1
2 2
(2)開啟檔案並並畫圖
reset
plot "testdata.txt"
如圖

(3)給點連上直線
在後面加上with linespoints
plot "testdata.txt" with linespoints5.設定檔案中的某列作為x或y軸座標
設testdata.txt內容如下
1 0 0 1
2 1 1 1
3 2 2 1
選取第2列作為x,第3列作為y,畫直線,如圖
plot "testdata.txt" u 2:3 with linespoints6.畫三維的點
以testdata.txt中的第2列作為x,第3列作為y,第4列作為z畫點
splot “testdata.txt” u 2:3:4
7.同一張圖上畫多條軌跡
只要每個函式用英文逗號隔開就可以了
如
plot "testdata.txt" u 2 w lp lt 1 title 'x', "testdata.txt" u 3 同一個影象畫出第二列和第三列的資料
8.不同圖上畫不同軌跡
需要新增set multiplot layout 行,列 指令
如
reset
set multiplot layout 2,1
plot "testdata.txt" u 2 w lp  lt 1 title 'x',
plot "testdata.txt" u 3 w lp lt 2 title 'y'
title ‘y’ 表示標題
lt 1 表示線型
參考
https://jingyan.baidu.com/article/ff42efa9da69f9c19e2202de.html