
winform和wpf下分別使用zedgraph控制元件
阿新 • • 發佈:2018-11-12
一、基本概念
ZedGraph是用於建立任意資料的二維線型、條型、餅型圖表的一個類庫,也可以作為Windows窗體使用者控制元件和Asp.Net網頁控制元件。這個類庫具有高度的適應性,幾乎所有式樣的圖表都能夠被建立。這個類庫的用法在於通過提供所有圖表屬性的省缺值來保持使用性的簡單。這個類庫包含了基於要繪製的數值範圍內的可選擇適當度量範圍和跨度的程式碼。
二、winform下使用zedgraph
1、下載ZedGraph.dll
2、新建winform工程,將ZedGraph.dll新增到工程中
(1)ZedGraph.dll複製到winform的debug檔案下,並引用

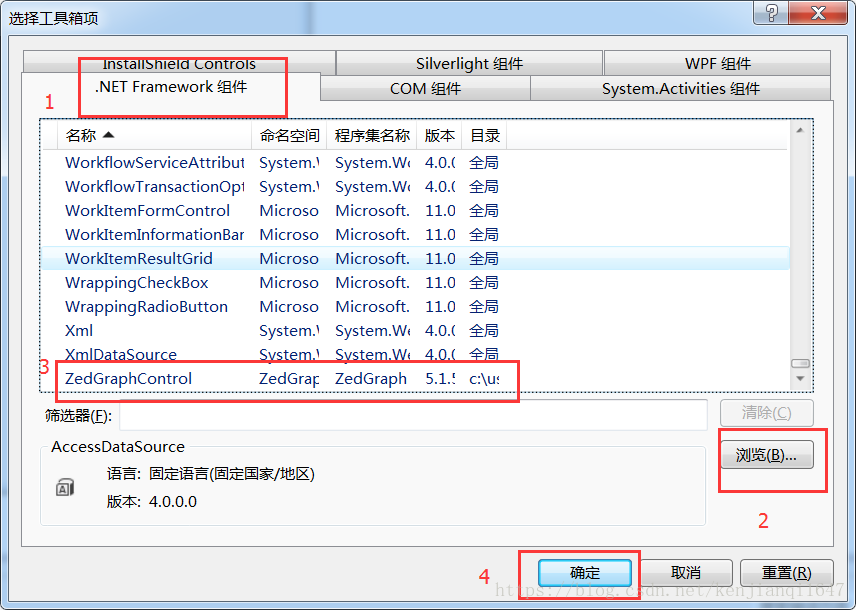
(2)將這個控制元件新增到工具箱中
工具箱-右鍵-選擇項

將zedgraph新增進來
3、使用zedgraph
(1)工具箱中將zedgraph拖動到winform介面

(2)後臺簡單使用
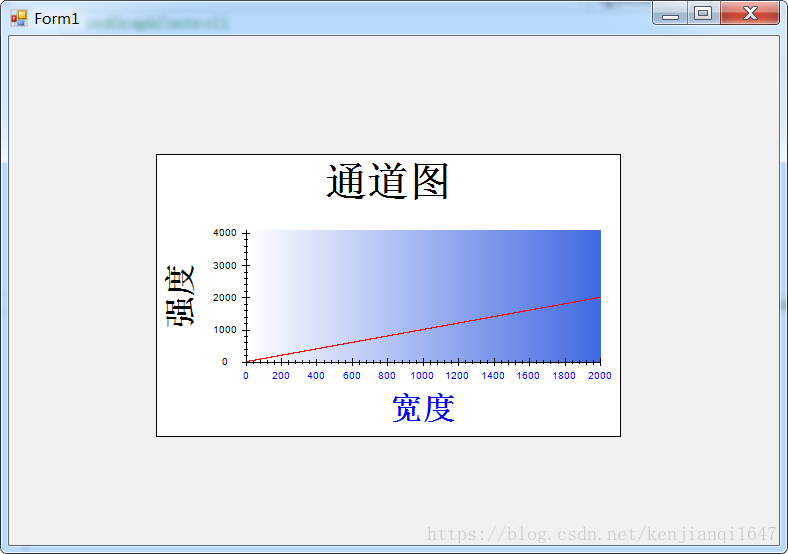
 private void zedGraphControl()
        {
             PointPairList list1 = new PointPairList();
            zedGraphControl1.GraphPane.Title.FontSpec.Size = 50;//設定標題大小
            zedGraphControl1.GraphPane.Title.Text  = "通道圖";//設定標題內容
            zedGraphControl1.GraphPane.XAxis.Title.FontSpec.Size = 40;//設定x軸標題大小
            zedGraphControl1.GraphPane.XAxis.Title.Text = "寬度";//X軸標題
            zedGraphControl1.GraphPane.XAxis.Title.FontSpec.FontColor = Color.Blue;////X軸標題顏色
            zedGraphControl1.GraphPane.XAxis.Scale.FontSpec.FontColor = Color.Blue;//設定x軸刻度顏色
            zedGraphControl1.GraphPane.YAxis.Title.FontSpec.Size = 40;
            zedGraphControl1.GraphPane.YAxis.Title.Text = "強度";
            //設定x軸的範圍
            zedGraphControl1.GraphPane.XAxis.Scale.Min = 0;//X軸的範圍
            zedGraphControl1.GraphPane.XAxis.Scale.Max = 2000;
            zedGraphControl1.GraphPane.XAxis.Scale.MinorStep = 40;//X軸小刻度 小跨度
            zedGraphControl1.GraphPane.XAxis.Scale.MajorStep = 200;//X軸大刻度  大跨度
            //清除X、Y軸對面的軸顯示
            zedGraphControl1.GraphPane.Chart.Border.IsVisible = false;//圖表邊框設定
            zedGraphControl1.GraphPane.XAxis.MajorTic.IsOpposite = false;
            zedGraphControl1.GraphPane.YAxis.MajorTic.IsOpposite = false;
            zedGraphControl1.GraphPane.YAxis.MinorTic.IsOpposite = false;
            zedGraphControl1.GraphPane.XAxis.MinorTic.IsOpposite = false;
            //設定Y軸的範圍
            zedGraphControl1.GraphPane.YAxis.Scale.Min = 0;
            zedGraphControl1.GraphPane.YAxis.Scale.Max = 4096;
            zedGraphControl1.GraphPane.YAxis.Scale.MinorStep = 200;
            zedGraphControl1.GraphPane.YAxis.Scale.MajorStep = 1000;


            for (int i = 0; i < 2000; i++)
            {
                list1.Add (i,i);
            }
            zedGraphControl1.GraphPane.CurveList.Clear();
            zedGraphControl1.GraphPane.AddCurve("", list1, Color.Red , SymbolType.None);//繪製圖表
            zedGraphControl1.GraphPane.Chart.Fill = new Fill(Color.White, Color.RoyalBlue, 0.0F);//設定圖表背景顏色

            zedGraphControl1.GraphPane.Legend.Border.Color = Color.Blue ;
            //座標軸範圍、刻度調整後需要加上下面的語句才能重新整理
            zedGraphControl1.AxisChange();
            zedGraphControl1.Refresh();
        }
測試效果:
三、WPF下使用
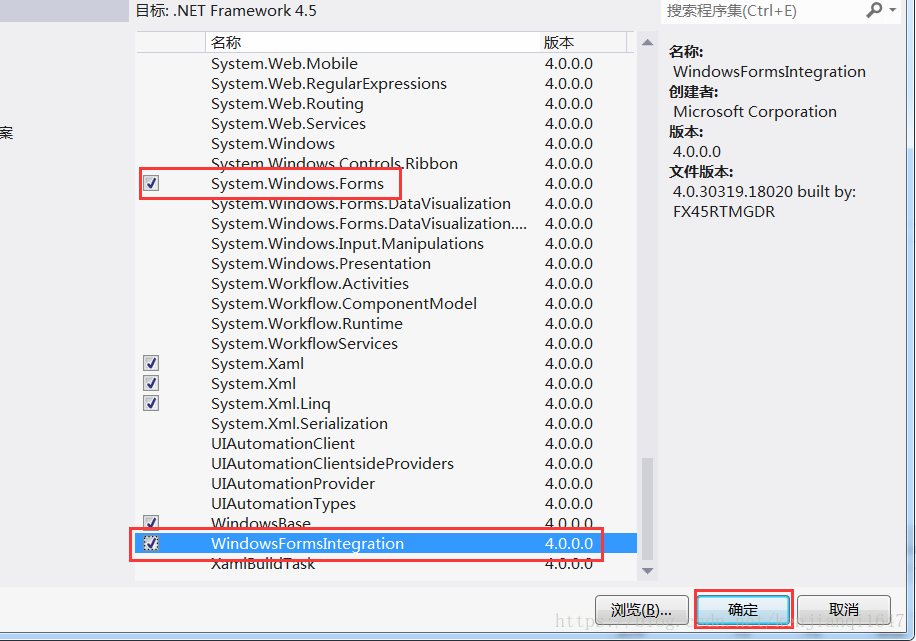
1、新增下面兩個dll檔案
2、引用zedgraph.dll
3、新增zedgraph
由於zedgraph是winform的控制元件,按照winform新增的方式發現工具箱中找不到zedgraph控制元件
前臺XAML:
<Window x:Class="WpfZedgraph.MainWindow"
        xmlns="http://schemas.microsoft.com/winfx/2006/xaml/presentation"
        xmlns:x="http://schemas.microsoft.com/winfx/2006/xaml"
        xmlns:wfi ="clr-namespace:System.Windows.Forms.Integration;assembly=WindowsFormsIntegration"
        xmlns:wf ="clr-namespace:System.Windows.Forms;assembly=System.Windows.Forms"
        xmlns:zedgraph="clr-namespace:ZedGraph;assembly=ZedGraph"
        Title="MainWindow" Height="350" Width="525" Loaded="Window_Loaded">
    <Grid HorizontalAlignment="Left" Height="322.4" VerticalAlignment="Top" Width="518.4">
        <DataGrid HorizontalAlignment="Left" VerticalAlignment="Top" Height="322" Width="518"/>
        <wfi:WindowsFormsHost>
            <zedgraph:ZedGraphControl x:Name="zedGraphControl" />
        </wfi:WindowsFormsHost>
    </Grid>

</Window>
<wfi:WindowsFormsHost></wfi:WindowsFormsHost>即為WinForm控制元件的宿主容器,每一個宿主容器只能放一個WinForm控制元件。
後臺C#:
using System;
using System.Collections.Generic;
using System.Linq;
using System.Text;
using System.Threading.Tasks;
using System.Windows;
using System.Windows.Controls;
using System.Windows.Data;
using System.Windows.Documents;
using System.Windows.Input;
using System.Windows.Media;
using System.Windows.Media.Imaging;
using System.Windows.Navigation;
using System.Windows.Shapes;
using System.Windows.Forms;
using ZedGraph;
using System.Drawing;
//using WindowsFormsIntergration;
namespace WpfZedgraph
{
    /// <summary>
    /// MainWindow.xaml 的互動邏輯
    /// </summary>
    public partial class MainWindow : Window
    {
        public MainWindow()
        {
            InitializeComponent();
        }
          private void Window_Loaded(object sender, RoutedEventArgs e)

        {
            ZedGraph.GraphPane myPane = zedGraphControl.GraphPane;
            myPane.Title.Text = "通道圖";
            myPane.XAxis.Title.Text = "寬度";
            myPane.YAxis.Title.Text = "強度";
            PointPairList list1 = new PointPairList();

            for (int i = 0; i <2000; i++)

            {
                list1.Add(i, i);
            }
            LineItem myCurve = myPane.AddCurve("Porsche", list1, System.Drawing.Color.Red, SymbolType.Diamond);
            zedGraphControl.AxisChange();//重新整理介面

        }

    }
}
測試效果:

四、總結
zedgraph在記憶體中將線畫好,最後一次性出圖,減少了對UI介面的重新整理次數,對於資料量大,重新整理速度快的線圖非常適合。同時X,Y的座標刻度和範圍可以自由的由程式改變。