
2.spring cloud服務註冊中心eureka server---新增Hystrix Dashboard(第四章)
Hystrix Dashboard
我們在熔斷示例專案spring-cloud-consumer-hystrix的基礎上更改,重新命名為:spring-cloud-consumer-hystrix-dashboard。
1、新增依賴
org.springframework.boot 版本 :2.1.0.RELEASE
org.springframework.cloud 版本:Greenwich.M1
<dependency>
<groupId>org.springframework.cloud</groupId>
<artifactId 2、啟動類
啟動類新增啟用Hystrix Dashboard和熔斷器
@SpringBootApplication
@EnableDiscoveryClient
@EnableFeignClients
@EnableCircuitBreaker
@EnableHystrixDashboard

public class SpringCloudConsumerApplication {

	public static void main(String[] args) {
		SpringApplication.run(SpringCloudConsumerApplication.class, args);

	}
	//spring boot 2.0.2之後需要註冊HystrixMetricsStreamServlet。啟動類中新增如下程式碼:用來向監控中心Dashboard傳送stream資訊
	@Bean
	public ServletRegistrationBean getServlet() {
		HystrixMetricsStreamServlet streamServlet = new HystrixMetricsStreamServlet();
		ServletRegistrationBean registrationBean = new ServletRegistrationBean(streamServlet);
		registrationBean.setLoadOnStartup(1);
		registrationBean.addUrlMappings("/hystrix.stream");
		registrationBean.setName("HystrixMetricsStreamServlet");
		return registrationBean;
	}
}
3、測試
啟動工程後訪問 http://localhost:9091/hystrix,將會看到如下介面:
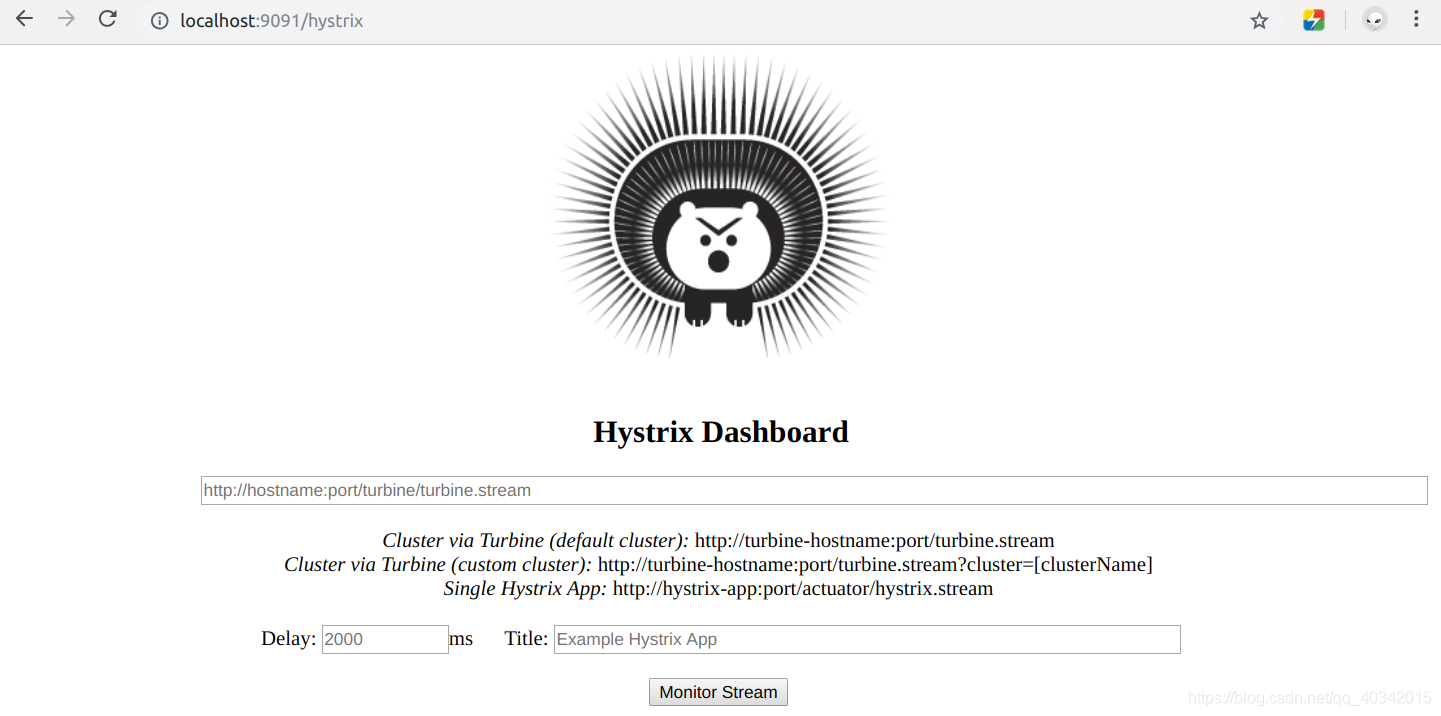
圖中會有一些提示:
Cluster via Turbine (default cluster): http://turbine-hostname:port/turbine.stream
Cluster via Turbine (custom cluster): http://turbine-hostname:port/turbine.stream?cluster=[clusterName]
Single Hystrix App: http://hystrix-app:port/hystrix.stream
大概意思就是如果檢視預設叢集使用第一個url,檢視指定叢集使用第二個url,單個應用的監控使用最後一個,我們暫時只演示單個應用的所以在輸入框中輸入: http://localhost:9091/hystrix.stream ,輸入之後點選 monitor,進入頁面。
如果沒有請求會先顯示Loading …,訪問http://localhost:9001/hystrix.stream 也會不斷的顯示ping。
請求服務http://localhost:9001/hello/llx,就可以看到監控的效果了,首先訪問http://localhost:9001/hystrix.stream,顯示如下:
ping:
data: {“type”:…}
data: {“type”:…}
說明已經返回了監控的各項結果
到監控頁面就會顯示如下圖:
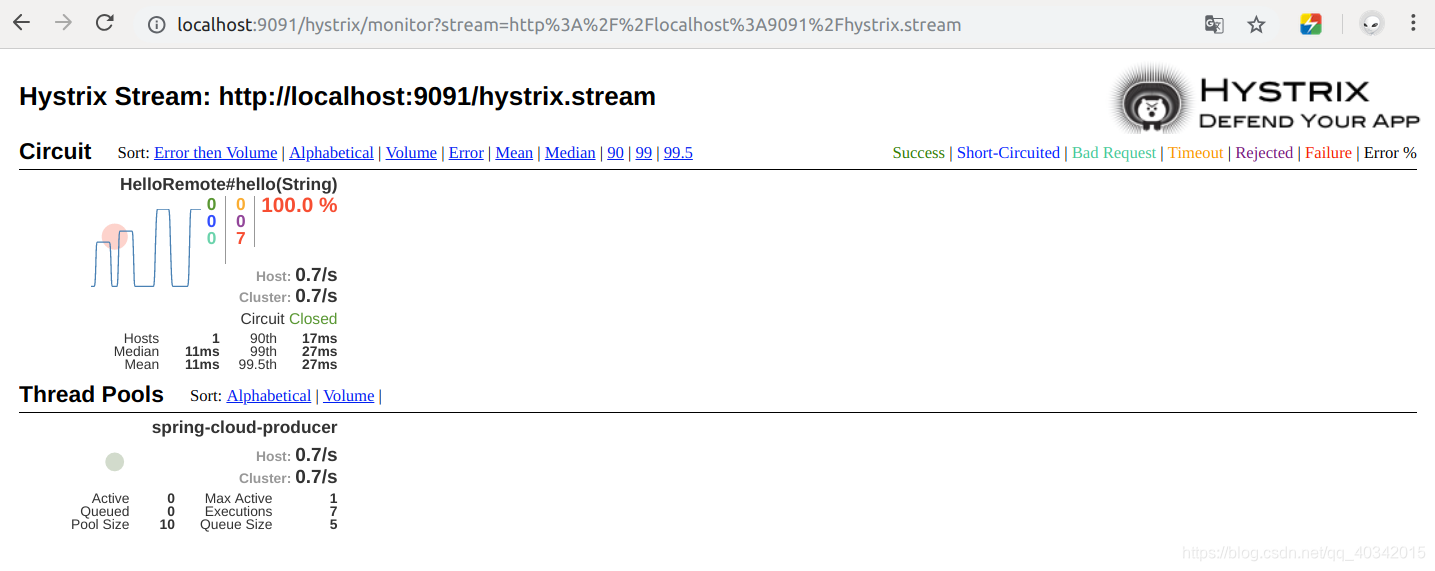
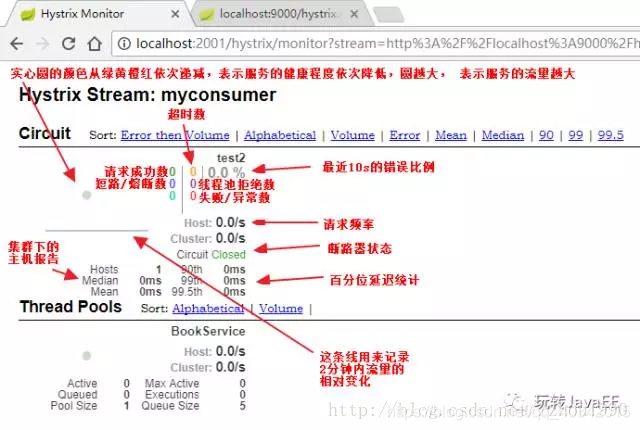
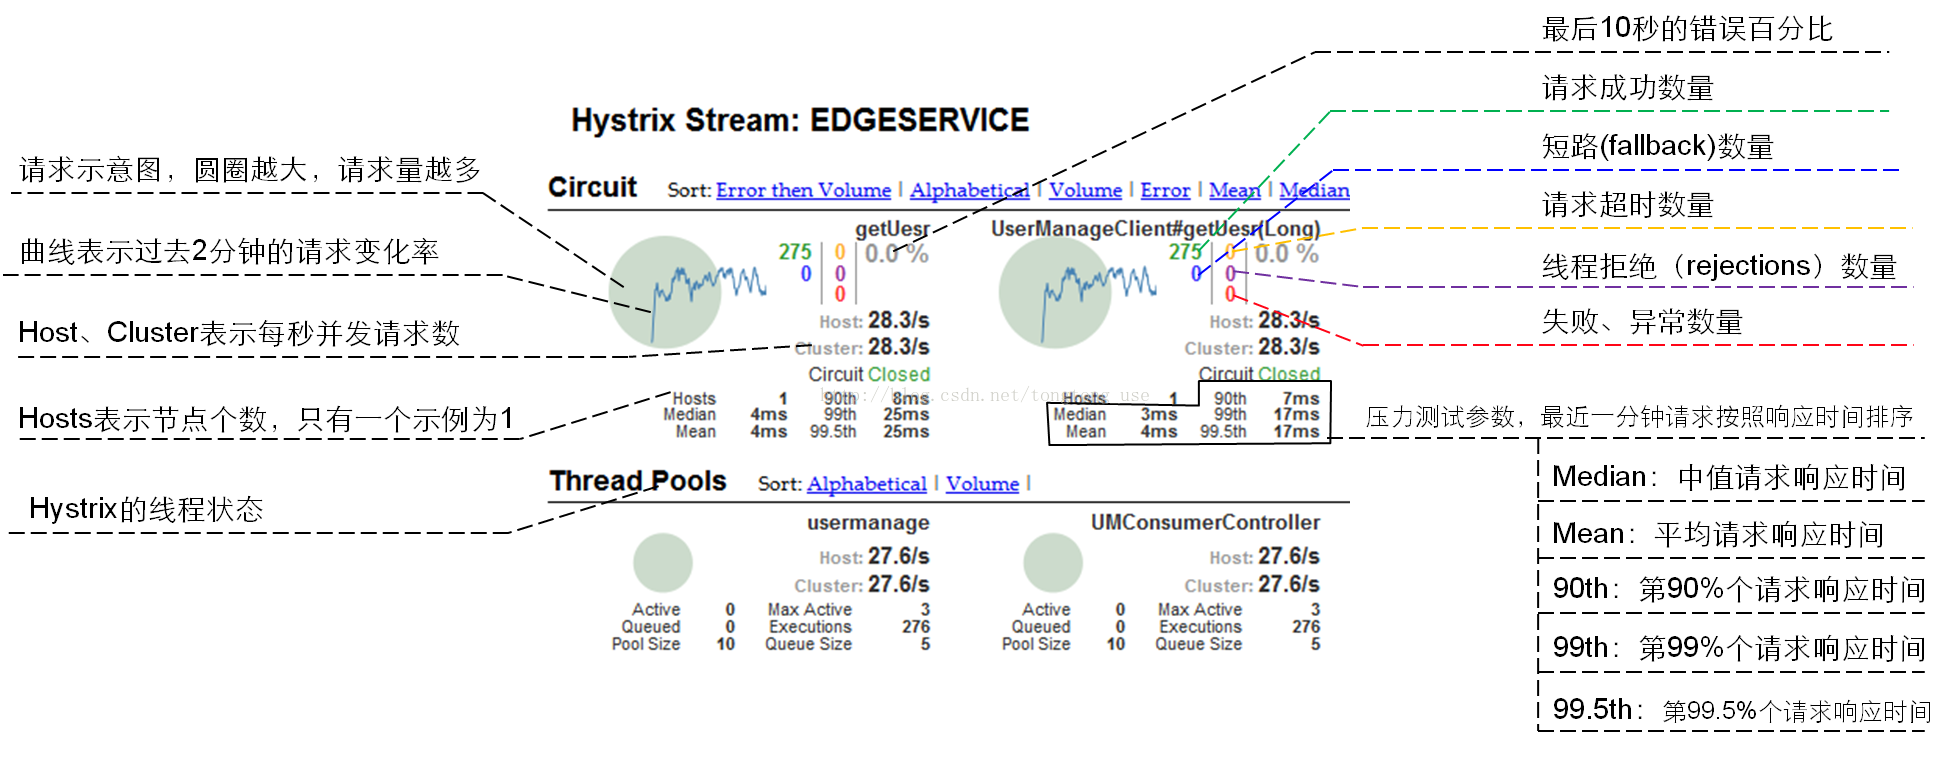
其實就是http://localhost:9091/hystrix.stream返回結果的圖形化顯示,Hystrix Dashboard Wiki上詳細說明了圖上每個指標的含義,如下圖:
到此單個應用的熔斷監控已經完成。