KNN演算法實現影象分類
首先,回顧k-Nearest Neighbor(k-NN)分類器,可以說是最簡單易懂的機器學習演算法。 實際上,k-NN非常簡單,根本不會執行任何“學習”,以及介紹k-NN分類器的工作原理。 然後,我們將k-NN應用於Kaggle Dogs vs. Cats資料集,這是Microsoft的Asirra資料集的一個子集。顧名思義,Dogs vs. Cats資料集的目標是對給定影象是否包含狗或貓進行分類。
Kaggle Dogs vs. Cats dataset
Dogs vs. Cats資料集實際上是幾年前Kaggle挑戰的一部分。 挑戰本身很簡單:給出一個影象,預測它是否包含一隻狗或一隻貓:

建立的工程檔案的結構
k-NN classifier for image classificationShell

$ tree --filelimit 10
.
├── kaggle_dogs_vs_cats
│   └── train [25000 entries exceeds filelimit, not opening dir]
└── knn_classifier.py

2 directories, 1 file
k-Nearest Neighbor分類器是迄今為止最簡單的機器學習/影象分類演算法。 事實上,它很簡單,實際上並沒有“學習”任何東西。
在內部,該演算法僅依賴於特徵向量之間的距離,就像構建影象搜尋引擎一樣 - 只是這次,我們有與每個影象相關聯的標籤,因此我們可以預測並返回影象的實際類別。
簡而言之,k-NN演算法通過找到k個最接近的例子中最常見的類來對未知資料點進行分類。 k個最近的例子中的每個資料點都投了一票,而得票最多的類別獲勝!
或者,用簡單的英語:“告訴我你的鄰居是誰,我會告訴你你是誰”。
在這裡我們可以看到有兩類影象,並且每個相應類別中的每個資料點在n維空間中相對靠近地分組。 我們的狗往往有深色的外套,不是很蓬鬆,而我們的貓有非常輕的外套非常蓬鬆。
這意味著紅色圓圈中兩個資料點之間的距離遠小於紅色圓圈中的資料點與藍色圓圈中的資料點之間的距離。
為了應用k-最近鄰分類,我們需要定義距離度量或相似度函式。 常見的選擇包括歐幾里德距離(差值平方和)、曼哈頓距離(絕對值距離)。可以根據資料型別使用其他距離度量/相似度函式(卡方距離通常用於分佈即直方圖)。 在今天的部落格文章中,為了簡單起見,我們將使用歐幾里德距離來比較影象的相似性。
建立knn.py
# import the necessary packages
from sklearn.neighbors import KNeighborsClassifier
from sklearn.model_selection import train_test_split
from imutils import paths
import numpy as np
import argparse
import imutils
import cv2
import os
def image_to_feature_vector(image, size=(32, 32)):
# resize the image to a fixed size, then flatten the image into
# a list of raw pixel intensities
return cv2.resize(image, size).flatten()
def extract_color_histogram(image, bins=(8, 8, 8)):
# extract a 3D color histogram from the HSV color space using
# the supplied number of `bins` per channel
hsv = cv2.cvtColor(image, cv2.COLOR_BGR2HSV)
hist = cv2.calcHist([hsv], [0, 1, 2], None, bins,
[0, 180, 0, 256, 0, 256])
# handle normalizing the histogram if we are using OpenCV 2.4.X
if imutils.is_cv2():
hist = cv2.normalize(hist)
# otherwise, perform "in place" normalization in OpenCV 3 (I
# personally hate the way this is done
else:
cv2.normalize(hist, hist)
# return the flattened histogram as the feature vector
return hist.flatten()
# construct the argument parse and parse the arguments
ap = argparse.ArgumentParser()
ap.add_argument("-d", "--dataset", required=True,
help="path to input dataset")
ap.add_argument("-k", "--neighbors", type=int, default=1,
help="# of nearest neighbors for classification")
ap.add_argument("-j", "--jobs", type=int, default=-1,
help="# of jobs for k-NN distance (-1 uses all available cores)")
args = vars(ap.parse_args())
# grab the list of images that we'll be describing
print("[INFO] describing images...")
imagePaths = list(paths.list_images(args["dataset"]))
# initialize the raw pixel intensities matrix, the features matrix,
# and labels list
rawImages = []
features = []
labels = []
# loop over the input images
for (i, imagePath) in enumerate(imagePaths):
# load the image and extract the class label (assuming that our
# path as the format: /path/to/dataset/{class}.{image_num}.jpg
image = cv2.imread(imagePath)
label = imagePath.split(os.path.sep)[-1].split(".")[0]
# extract raw pixel intensity "features", followed by a color
# histogram to characterize the color distribution of the pixels
# in the image
pixels = image_to_feature_vector(image)
hist = extract_color_histogram(image)
# update the raw images, features, and labels matricies,
# respectively
rawImages.append(pixels)
features.append(hist)
labels.append(label)
# show an update every 1,000 images
if i > 0 and i % 1000 == 0:
print("[INFO] processed {}/{}".format(i, len(imagePaths)))
# show some information on the memory consumed by the raw images
# matrix and features matrix
rawImages = np.array(rawImages)
features = np.array(features)
labels = np.array(labels)
print("[INFO] pixels matrix: {:.2f}MB".format(
rawImages.nbytes / (1024 * 1000.0)))
print("[INFO] features matrix: {:.2f}MB".format(
features.nbytes / (1024 * 1000.0)))
N classifier for image classificationPython
# import the necessary packages
from sklearn.neighbors import KNeighborsClassifier
from sklearn.cross_validation import train_test_split
from imutils import paths
import numpy as np
import argparse
import imutils
import cv2
import os
def image_to_feature_vector(image, size=(32, 32)):
# resize the image to a fixed size, then flatten the image into
# a list of raw pixel intensities
return cv2.resize(image, size).flatten()
def extract_color_histogram(image, bins=(8, 8, 8)):
# extract a 3D color histogram from the HSV color space using
# the supplied number of `bins` per channel
hsv = cv2.cvtColor(image, cv2.COLOR_BGR2HSV)
hist = cv2.calcHist([hsv], [0, 1, 2], None, bins,
[0, 180, 0, 256, 0, 256])
# handle normalizing the histogram if we are using OpenCV 2.4.X
if imutils.is_cv2():
hist = cv2.normalize(hist)
# otherwise, perform "in place" normalization in OpenCV 3 (I
# personally hate the way this is done
else:
cv2.normalize(hist, hist)
# return the flattened histogram as the feature vector
return hist.flatten()
# construct the argument parse and parse the arguments
ap = argparse.ArgumentParser()
ap.add_argument("-d", "--dataset", required=True,
help="path to input dataset")
ap.add_argument("-k", "--neighbors", type=int, default=1,
help="# of nearest neighbors for classification")
ap.add_argument("-j", "--jobs", type=int, default=-1,
help="# of jobs for k-NN distance (-1 uses all available cores)")
args = vars(ap.parse_args())
# grab the list of images that we'll be describing
print("[INFO] describing images...")
imagePaths = list(paths.list_images(args["dataset"]))
# initialize the raw pixel intensities matrix, the features matrix,
# and labels list
rawImages = []
features = []
labels = []
# loop over the input images
for (i, imagePath) in enumerate(imagePaths):
# load the image and extract the class label (assuming that our
# path as the format: /path/to/dataset/{class}.{image_num}.jpg
image = cv2.imread(imagePath)
label = imagePath.split(os.path.sep)[-1].split(".")[0]
# extract raw pixel intensity "features", followed by a color
# histogram to characterize the color distribution of the pixels
# in the image
pixels = image_to_feature_vector(image)
hist = extract_color_histogram(image)
# update the raw images, features, and labels matricies,
# respectively
rawImages.append(pixels)
features.append(hist)
labels.append(label)
# show an update every 1,000 images
if i > 0 and i % 1000 == 0:
print("[INFO] processed {}/{}".format(i, len(imagePaths)))
# show some information on the memory consumed by the raw images
# matrix and features matrix
rawImages = np.array(rawImages)
features = np.array(features)
labels = np.array(labels)
print("[INFO] pixels matrix: {:.2f}MB".format(
rawImages.nbytes / (1024 * 1000.0)))
print("[INFO] features matrix: {:.2f}MB".format(
features.nbytes / (1024 * 1000.0)))
# partition the data into training and testing splits, using 75%
# of the data for training and the remaining 25% for testing
(trainRI, testRI, trainRL, testRL) = train_test_split(
rawImages, labels, test_size=0.25, random_state=42)
(trainFeat, testFeat, trainLabels, testLabels) = train_test_split(
features, labels, test_size=0.25, random_state=42)
# train and evaluate a k-NN classifer on the raw pixel intensities
print("[INFO] evaluating raw pixel accuracy...")
model = KNeighborsClassifier(n_neighbors=args["neighbors"],
n_jobs=args["jobs"])
model.fit(trainRI, trainRL)
acc = model.score(testRI, testRL)
print("[INFO] raw pixel accuracy: {:.2f}%".format(acc * 100))
# train and evaluate a k-NN classifer on the histogram
# representations
print("[INFO] evaluating histogram accuracy...")
model = KNeighborsClassifier(n_neighbors=args["neighbors"],
n_jobs=args["jobs"])
model.fit(trainFeat, trainLabels)
acc = model.score(testFeat, testLabels)
print("[INFO] histogram accuracy: {:.2f}%".format(acc * 100))下載貓狗資料集放在指定位置,執行
python knn_classifier.py --dataset kaggle_dogs_vs_cats
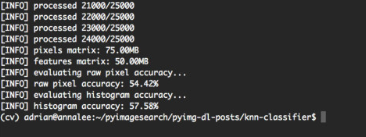
通過利用原始畫素強度,我們能夠達到54.42%的準確度。 另一方面,將k-NN應用於顏色直方圖獲得了略高的57.58%的準確度。可以看到,僅僅通過顏色直方圖進行分類不是非常好的方法,對於具體案例來看,貓和狗的顏色可能是相同的,這樣就存在誤分類。當然這裡是應用KNN做簡單的分類例項,實際上非常容易的使用卷積神經網路能夠達到95%以上的分類準確率。
下面講一下利用knn演算法進行分類
使用sklearn演算法庫進行引數調優,看看結果如何。
這裡用到的是sklearn庫中的grid search和random search函式對超引數組成的字典進行搜尋,用knn演算法模型度超引數字典搜尋迭代。
程式碼:
# import the necessary packages
from sklearn.neighbors import KNeighborsClassifier
from sklearn.grid_search import RandomizedSearchCV
from sklearn.grid_search import GridSearchCV
from sklearn.cross_validation import train_test_split
from imutils import paths
import numpy as np
import argparse
import imutils
import time
import cv2
import os

def extract_color_histogram(image, bins=(8, 8, 8)):
	# extract a 3D color histogram from the HSV color space using
	# the supplied number of `bins` per channel
	hsv = cv2.cvtColor(image, cv2.COLOR_BGR2HSV)
	hist = cv2.calcHist([hsv], [0, 1, 2], None, bins,
		[0, 180, 0, 256, 0, 256])

	# handle normalizing the histogram if we are using OpenCV 2.4.X
	if imutils.is_cv2():
		hist = cv2.normalize(hist)

	# otherwise, perform "in place" normalization in OpenCV 3 (I
	# personally hate the way this is done
	else:
		cv2.normalize(hist, hist)

	# return the flattened histogram as the feature vector
	return hist.flatten()

# construct the argument parse and parse the arguments
ap = argparse.ArgumentParser()
ap.add_argument("-d", "--dataset", required=True,
	help="path to input dataset")
ap.add_argument("-j", "--jobs", type=int, default=-1,
	help="# of jobs for k-NN distance (-1 uses all available cores)")
args = vars(ap.parse_args())

# grab the list of images that we'll be describing
print("[INFO] describing images...")
imagePaths = list(paths.list_images(args["dataset"]))

# initialize the data matrix and labels list
data = []
labels = []

# loop over the input images
for (i, imagePath) in enumerate(imagePaths):
	# load the image and extract the class label (assuming that our
	# path as the format: /path/to/dataset/{class}.{image_num}.jpg
	image = cv2.imread(imagePath)
	label = imagePath.split(os.path.sep)[-1].split(".")[0]

	# extract a color histogram from the image, then update the
	# data matrix and labels list
	hist = extract_color_histogram(image)
	data.append(hist)
	labels.append(label)

	# show an update every 1,000 images
	if i > 0 and i % 1000 == 0:
		print("[INFO] processed {}/{}".format(i, len(imagePaths)))

# partition the data into training and testing splits, using 75%
# of the data for training and the remaining 25% for testing
print("[INFO] constructing training/testing split...")
(trainData, testData, trainLabels, testLabels) = train_test_split(
	data, labels, test_size=0.25, random_state=42)

# construct the set of hyperparameters to tune
params = {"n_neighbors": np.arange(1, 31, 2),
	"metric": ["euclidean", "cityblock"]}

# tune the hyperparameters via a cross-validated grid search
print("[INFO] tuning hyperparameters via grid search")
model = KNeighborsClassifier(n_jobs=args["jobs"])
grid = GridSearchCV(model, params)
start = time.time()
grid.fit(trainData, trainLabels)

# evaluate the best grid searched model on the testing data
print("[INFO] grid search took {:.2f} seconds".format(
	time.time() - start))
acc = grid.score(testData, testLabels)
print("[INFO] grid search accuracy: {:.2f}%".format(acc * 100))
print("[INFO] grid search best parameters: {}".format(
	grid.best_params_))

# tune the hyperparameters via a randomized search
grid = RandomizedSearchCV(model, params)
start = time.time()
grid.fit(trainData, trainLabels)

# evaluate the best randomized searched model on the testing
# data
print("[INFO] randomized search took {:.2f} seconds".format(
	time.time() - start))
acc = grid.score(testData, testLabels)
print("[INFO] grid search accuracy: {:.2f}%".format(acc * 100))
print("[INFO] randomized search best parameters: {}".format(
	grid.best_params_))
執行
python knn_tune.py --dataset kaggle_dogs_vs_cats
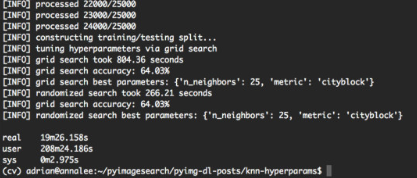
從輸出螢幕截圖中可以看出,網格搜尋方法發現k = 25且metric ='cityblock'獲得的最高準確度為64.03%。 但是,這次網格搜尋耗時13分鐘。另一方面,隨機搜尋獲得了相同的64.03%的準確度 - 並且在5分鐘內完成。所以在大多數情況下使用random search調優。
