
echart——時間點和時間段綜合顯示
阿新 • • 發佈:2018-11-22
效果圖
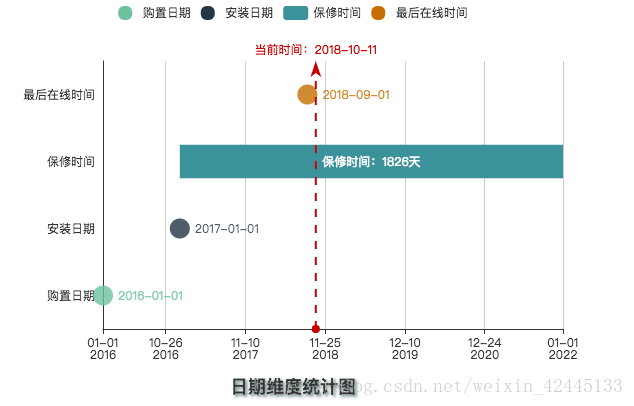
html 程式碼
<!DOCTYPE html>
<html lang="en">
<head>
    <meta charset="UTF-8">
    <title>Title</title>
</head>
<body>
    <!-- 1.先新增一個容器存放圖表  -->
    <div id="main" style="width: 600px;height: 400px"></div>

</body>
<script type="text/javascript" src="echarts.min.js"></script>
<script type="text/javascript" src="dateview.js"></script>
</html>
dateview.js 程式碼
js裡所有的時間為手動填上去的測試時間,後期專案裡應該都是從後來拿的資料
// 2.1 初始化echars物件
var myChart = echarts.init(document.getElementById('main'));

// 計算保修有多少天
var date_waranty_start = new Date('2017-01-01');
var date_waranty_end = new Date('2022-01-01');
var days = parseInt(date_waranty_end - date_waranty_start) / 1000 / 60 / 60 / 24;
// console.log(days);

// 2.2 設定圖表的配置引數
var option = {

    title: {
        text: "日期維度統計圖",
        textStyle: {
            textShadowColor: "#677c81",
            textShadowBlur: 4,
            textShadowOffsetX: 2,
            textShadowOffsetY: 2,
        },
        bottom: 'bottom',
        right: 'center',

    },

    tooltip: {
        trigger: 'axis',
        axisPointer: {            // 座標軸指示器,座標軸觸發有效
            type: 'shadow'        // 預設為直線,可選為:'line' | 'shadow'
        },
        // 自定義提示框顯示內容,若為空則不顯示
        formatter: function (params) {
            var res = '';
            for (var i = 0; i < params.length; i++) {
                if (params[i].data != null) {
                    if (params[i].name == '保修時間') {
                        res += '保修開始時間:' + params[i].data + '<br>' + '保修截止時間:' + params[i + 1].data + '<br>';
                        return res
                    } else {
                        var icon = '<span style="display:inline-block;margin-right:5px;border-radius:10px;width:9px;height:9px;background-color:' + params[i].color + ';"></span>';
                        res += icon + params[i].name + ':' + params[i].data + '<br>'
                    }
                }
            }
            return res;
        },
    },
    legend: {
        data: ['購置日期', '安裝日期', '保修時間', '最後線上時間']
    },
    grid: {
        left: '5%',
        right: '5%',
        bottom: '10%',
        containLabel: true
    },
    xAxis: {
        type: 'time'
    },
    yAxis: {
        type: 'category',
        axisTick: {show: false},
        data: ['購置日期', '安裝日期', '保修時間', '最後線上時間'],

    },
    series: [

        {
            name: '購置日期',
            type: 'scatter',
            symbolSize: 20,
            label: {
                normal: {
                    show: true,
                    position: 'right',
                    formatter: '{c}',
                }
            },
            itemStyle: {
                normal: {
                    color: '#80BC9E'
                }
            },
            data: ['2016-01-01']
        },
        {
            name: '安裝日期',
            type: 'scatter',
            symbolSize: 20,
            label: {
                normal: {
                    show: true,
                    position: 'right',
                    formatter: '{c}',
                }
            },
            itemStyle: {
                normal: {
                    color: '#243542'
                }
            },
            data: [null, '2017-01-01']
        },
        {
            name: '保修開始時間',
            type: 'bar',
            stack: '保修',
            label: {
                normal: {
                    show: false
                }
            },
            itemStyle: {
                normal: {
                    color: "rgba(0,0,0,0)"
                },
            },

            barCategoryGap: "50%",  //類目間柱形距離,預設為類目間距的20%,可設固定值
            data: [null, null, '2017-01-01']
        },

        {
            name: '保修時間',
            type: 'bar',
            stack: '保修',
            label: {
                normal: {
                    show: true,
                    formatter: '保修時間:' + days + '天'
                },

            },
            itemStyle: {
                normal: {
                    color: "#508F98"
                },
            },
            barCategoryGap: "50%",  //類目間柱形距離,預設為類目間距的20%,可設固定值
            data: [null, null, '2022-01-01']
        },
        {
            name: '最後線上時間',
            type: 'scatter',
            symbolSize: 20,
            label: {
                normal: {
                    show: true,
                    position: 'right',
                    formatter: '{c}',
                }
            },
            itemStyle: {
                normal: {
                    color: '#BC731E'
                }
            },
            data: [null, null, null, '2018-09-01'],
            markLine: {
                lineStyle: {
                    normal: {
                        type: 'dashed',
                        width: 2,
                        color: '#b62314',
                    },
                },
                label: {
                    normal: {
                        formatter: '當前時間:' + '2018-10-11'
                    },
                },
                data: [
                    {xAxis: '2018-10-11'},
                ]
            },
        },


    ]
};

// 3.3 渲染圖表
myChart.setOption(option);