
linux平均負載的理解及原因排查
當系統響應緩慢時,一般會用top或uptime命令檢視系統負載是否過高。 例如輸入uptime命令顯示如下圖,其中23:47:19表示現在的時間,up 260 days,14:39表示系統運行了多久,1 user表示當前登入使用者數,最重要的是 load average,有三個數值,分別表示過去1分鐘、5分鐘、15分鐘系統的負載。系統負載的英文解釋為:
System load averages is the average number of processes that are either in a runnable or uninterruptable state. A process in a runnable state is either using the CPU or waiting to use the CPU. A
process in uninterruptable state is waiting for some I/O access, eg waiting for disk. The averages are taken over the three time intervals. Load averages are not normalized for the number of
CPUs in a system, so a load average of 1 means a single CPU system is loaded all the time while on a 4 CPU system it means it was idle 75% of the time.
系統負載表示每分鐘處於可執行狀態(執行態和就緒態)以及不可中斷狀態(等待io)的程序數目,且沒有做歸一化處理。

圖1 uptime命令顯示圖
當平均負載等於CPU核數時是比較合理的狀態,不會存在程序等待且也不會有CPU空閒浪費,檢視CPU核數的命令如下:
grep 'model name' /proc/cpuinfo | wc -l
uptime命令過去1分鐘,5分鐘,15分鐘的負載隱含了系統負載的變化趨勢,假如這三個指標的值差不多,說明系統比較穩定,假如過去1分鐘的負載比過去15分鐘大很多,說明系統負載在增加,反之,則說明負載在減小。
平均負載和CPU使用率不是一個概念,平均負載高不能說明CPU使用率高,因為平均負載除了包括正在使用CPU的程序,還包括在等待CPU的程序和等待io的程序。
CPU使用率表示單位時間CPU的利用情況,CPU使用率和平均負載的關係有三個場景:
- CPU密集型程序,大量使用CPU會使CPU利用率和平均負載都增高。
- IO密集型程序,會使平均負載增高但CPU使用率不一定會增高。
- 大量等待CPU的程序排程會使平均負載增高,CPU使用率也會增高
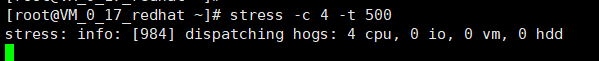
可使用stress模擬這三種情況,stress為linux下的壓測工具,並用mpstat和pidstat檢視根源,mpstat顯示CPU的使用情況,pidstat監視linux任務的統計資訊,安裝如下:
yum install stress sysstat
stress命令常用引數如下:
-c, --cpu N
spawn N workers spinning on sqrt()
-i, --io N
spawn N workers spinning on sync()
-t, --timeout N
timeout after N seconds
1.用stress模擬CPU密集型程序

用uptime檢視負載

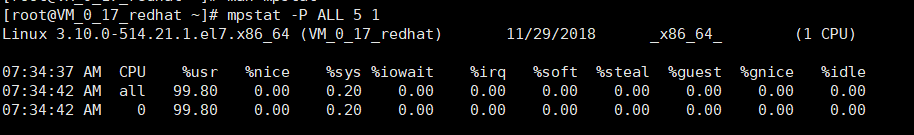
用mpstat檢視CPU使用情況,如下,其中-P的含義為
-P { cpu [,...] | ON | ALL }
Indicate the processor number for which statistics are to be reported. cpu is the processor number. Note that processor 0 is the first processor. The ON keyword indicates that statistics
are to be reported for every online processor, whereas the ALL keyword indicates that statistics are to be reported for all processors.表示顯示哪個處理器的使用情況. 5表示統計間隔為5s
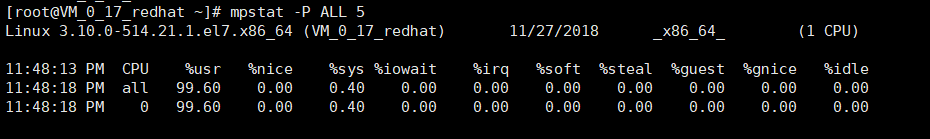
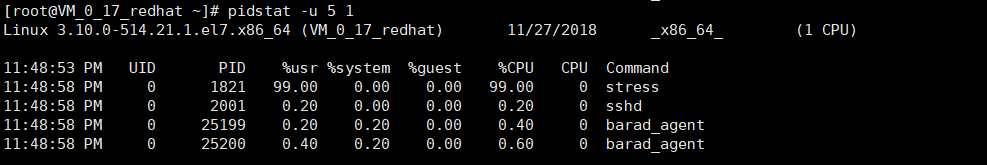
可以看到CPU使用率很高,pidstat檢視具體佔用CPU的程序,程序stress佔的CPU達到99%,-u的含義為Report CPU utilization,5表示間隔5秒,1表示輸出一組資料就停止,假如不加1,則會一直輸出。
2.stress模擬io密集型程序

uptime檢視負載,可以看到負載已經很高(單核CPU)

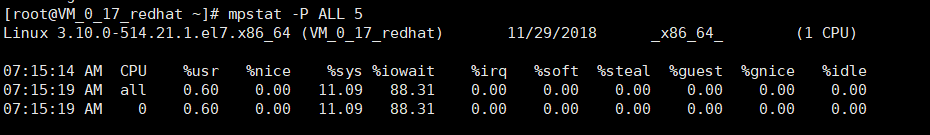
mpstat檢視負載升高原因,可以看到CPU0的iowait高達88.31%,說明CPU有大量的時間在等待磁碟io,負載是由io程序導致,iowait含義:%iowait
Show the percentage of time that the CPU or CPUs were idle during which the system had an outstanding disk I/O request.
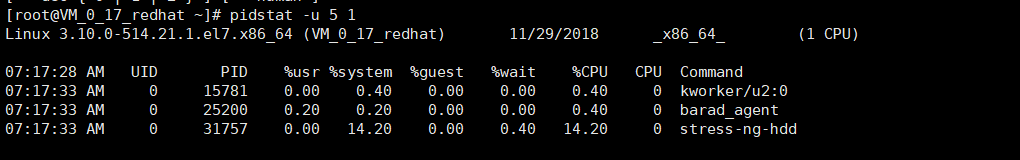
定位具體的程序,可以看到是stress-ng-hdd,wait含義
Percentage of CPU spent by the task while waiting to run.
3.stress模擬大量程序場景
uptime檢視負載

mpstat可以看到CPU利用率已經很高
pidstat檢視每個程序的CPU使用情況,四個stress程序均在有較高的百分比在等待CPU(%wait)

當uptime負載較高時,可能是CPU使用率較高,也可能是io程序較多,可以用mpstat檢視CPU使用情況,並用pidstat檢視定位具體程序