
Python矩陣作相簿matplotlib的初級使用
阿新 • • 發佈:2018-12-02
- matplotlib背景介紹:
第三方庫matplotlib(沒有的話,可在終端輸入"pip install matplotlib"進行安裝)是一款高質量的2D作相簿,可被廣泛地應用於支援Python的環境中。並且,如果在某些情境下需要繪製一些基礎的3D圖,這個時候可以結合標準庫mpl_toolkits.mplot3d來使用。出於Python語言的便攜性,從而為我們提供了一套輕量級的作圖方案。
由於網路上的資料大多不太符合官方推薦的作圖方式,且很多內容並沒有一個清晰的邏輯。筆者此處重新整理幾個簡單的示例,僅供參考!
- 簡單作圖示例:

1
View Codeimport numpy 2 import matplotlib.pyplot as plt 3 4 x = numpy.linspace(0, 2, 100) 5 6 plt.figure(figsize=(8, 4)) 7 8 plt.plot(x, x, label='linear') 9 plt.plot(x, x**2, label='quadratic') 10 plt.plot(x, x**3, label='cubic') 11 12 # 設定展示區間 13 plt.xlim(-1, 3) 14 plt.ylim(-1, 10) 15 16 # 設定展示資訊 17plt.xlabel('$x$') 18 plt.ylabel('$y$') 19 plt.title('simple_plot') 20 plt.legend(loc='best') 21 22 # 儲存圖片 23 plt.savefig(fname='test_plot.png', dpi=500) 24 25 # 展示圖片 26 plt.show() 27 # 關閉圖片 28 plt.close()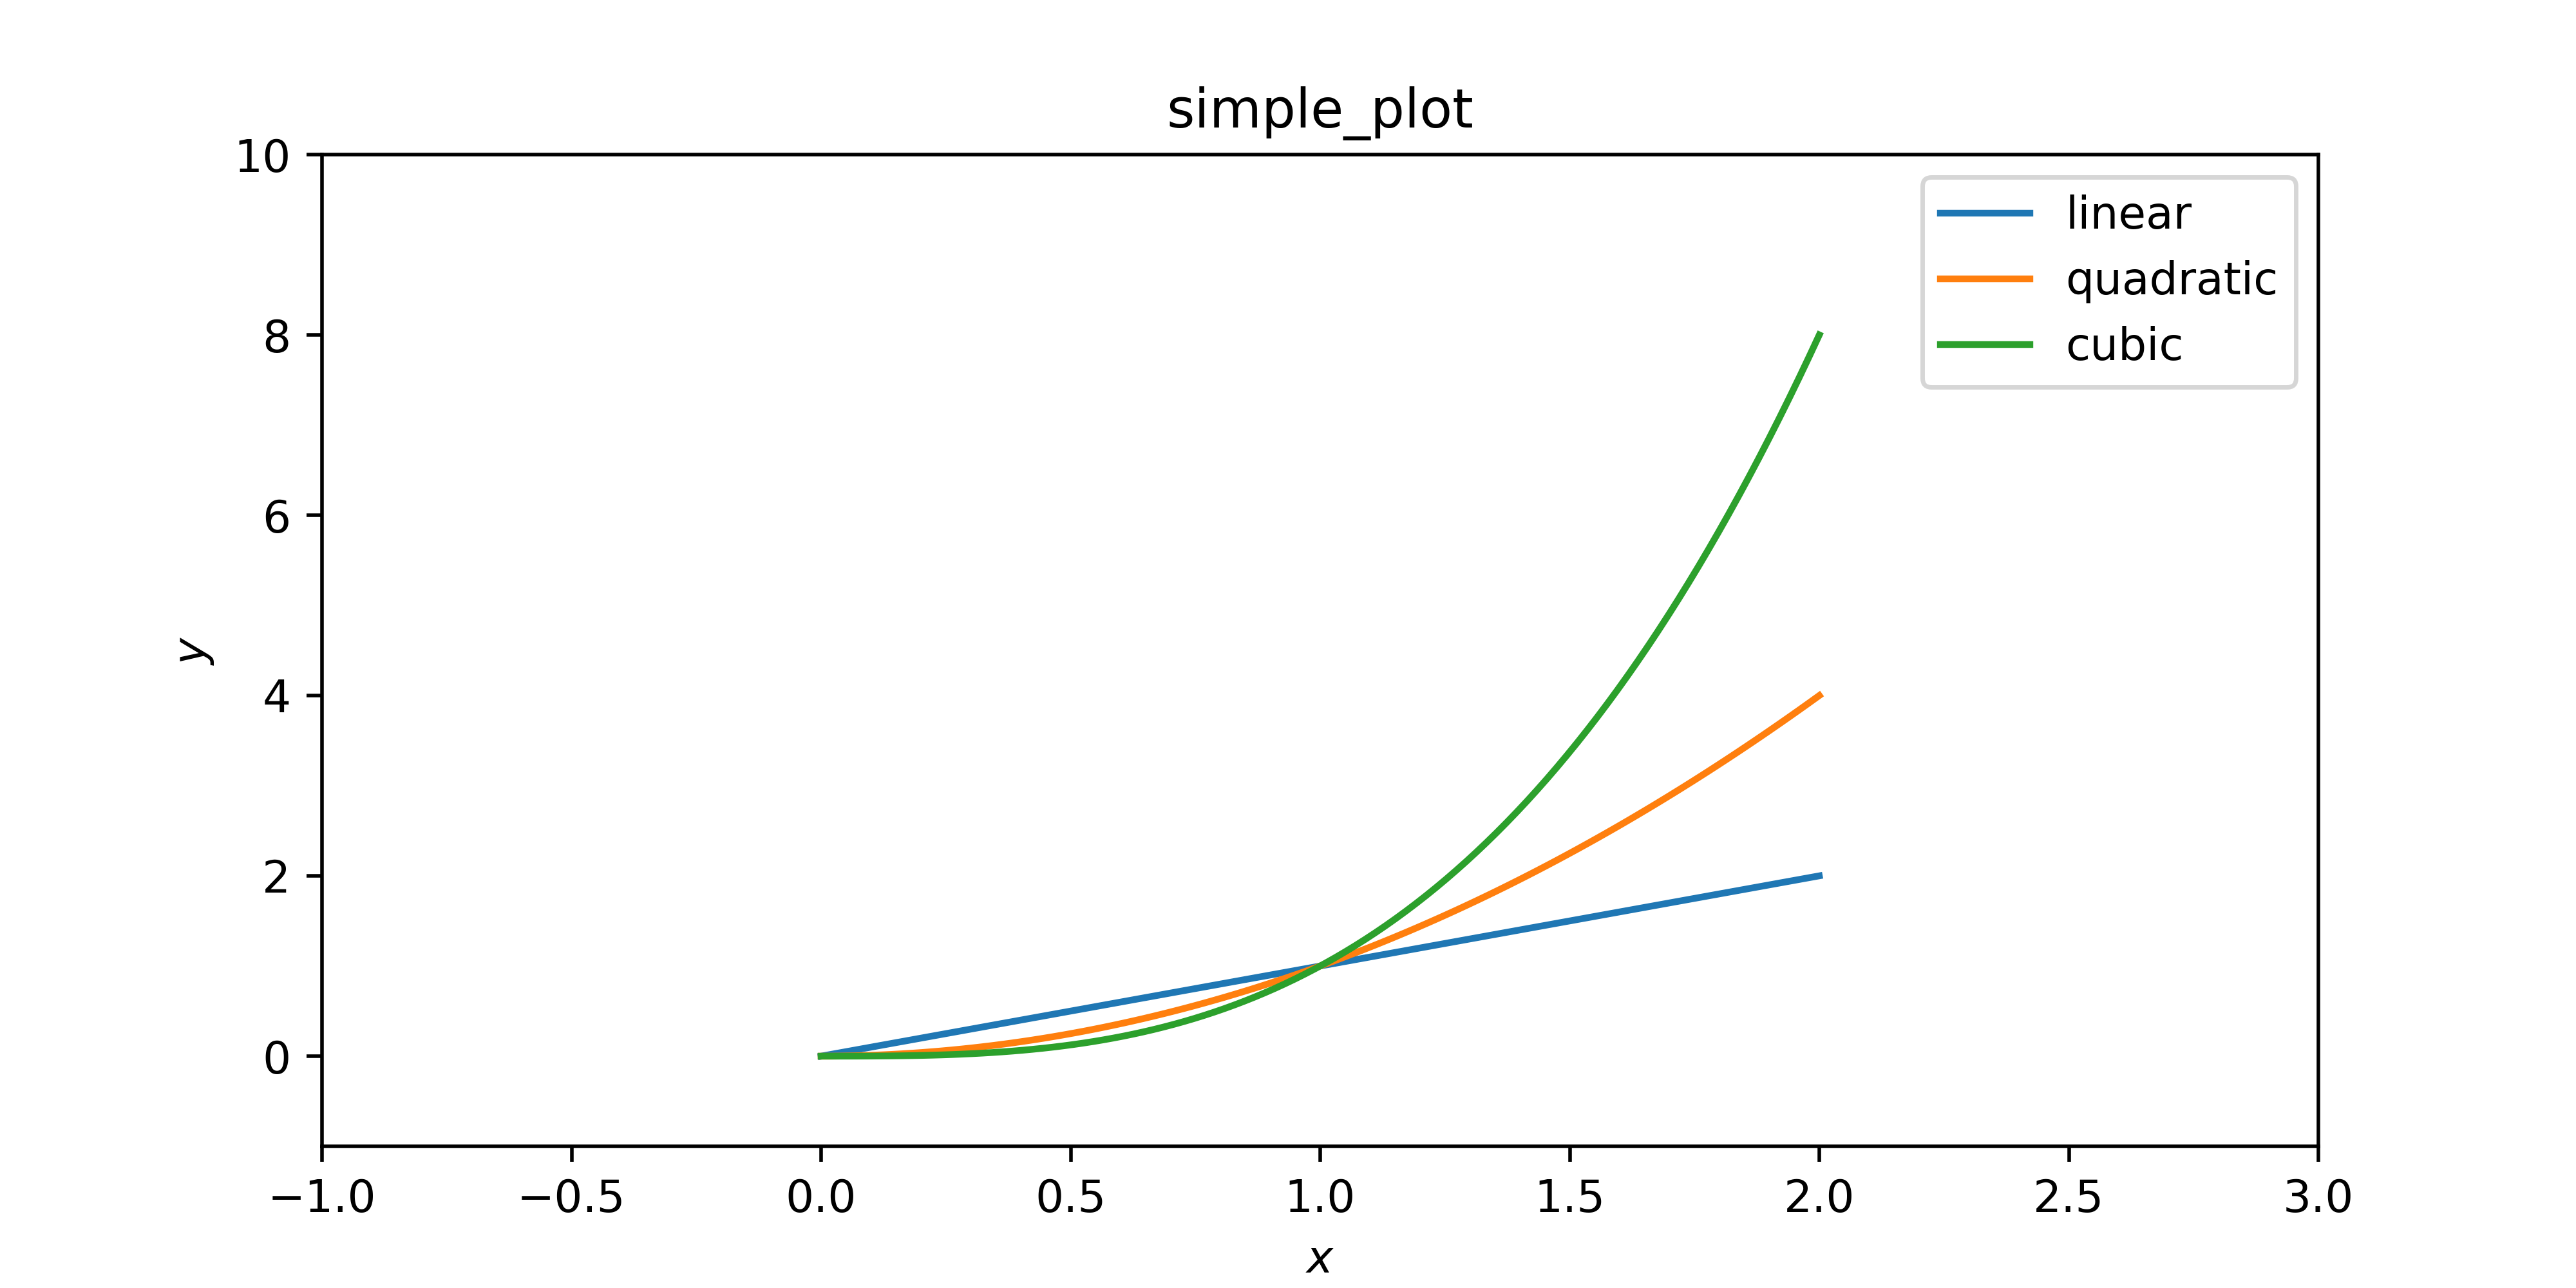
- 複雜作圖示例:
明確三層作圖物件:
1. 整個圖片物件 $\rightarrow$ figure
2. 圖片內的子圖物件 $\rightarrow$ axes
3. 子圖內的軸物件$\rightarrow$ axis
 1 import numpy
 2 import matplotlib.pyplot as plt
 3
 4 # 明確三層作圖物件: figure, axes, axis
 5 # 整個圖片物件, 圖片內的子圖物件, 子圖內的軸物件
 6
 7 x = numpy.linspace(0, 2, 100)
 8 y = 1 + numpy.sin(2 * numpy.pi * x)
 9
10 # 建立圖片物件
11 fig = plt.figure(figsize=(8, 4))
12 fig.suptitle('figure_title')
13
14 # 建立子圖物件
15 axes = plt.subplot()
16 axes.plot(x, y, label='$sin(x)$')
17 axes.set(xlim=(-1, 3), ylim=(-1, 10), xlabel='$x$', ylabel='$y$', title='axes_title')
18 axes.grid()
19 axes.legend()
20
21 # fig.tight_layout()
22 fig.savefig('test_plot.png', dpi=500)
23
24 plt.show()
25 plt.close()
View Code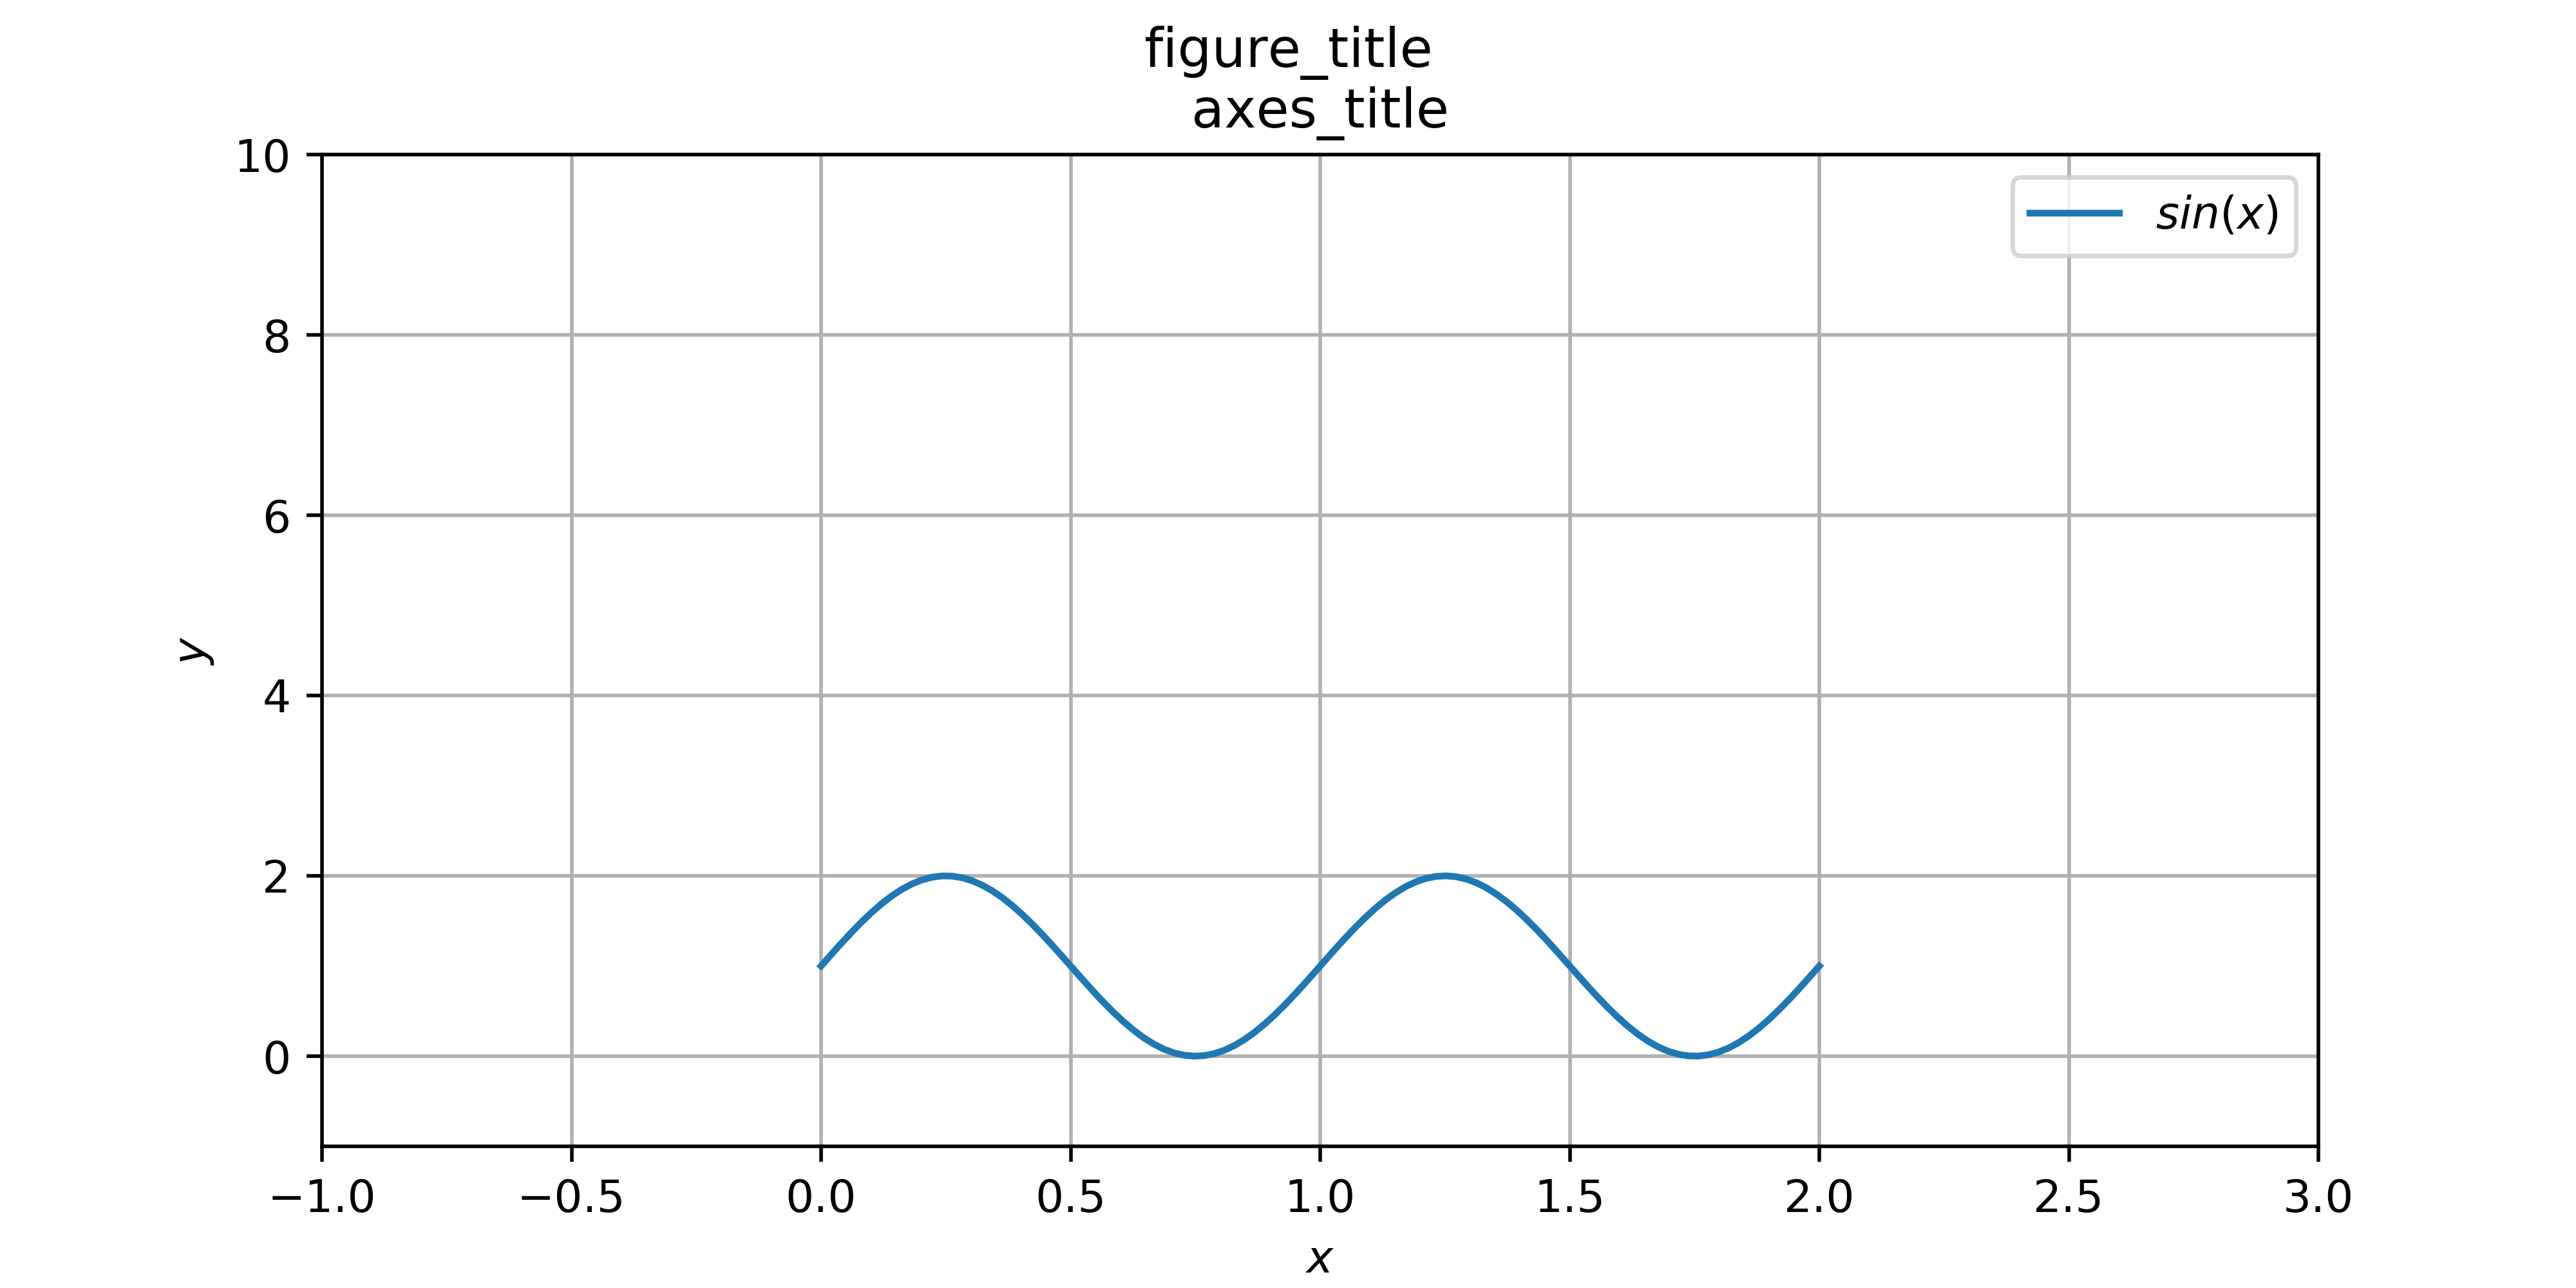

- 複雜作圖 $\rightarrow$ 多型別示例:
 1 import numpy
 2 import matplotlib.pyplot as plt
 3
 4 # 建立圖片物件
 5 fig = plt.figure(figsize=(8, 4))
 6
 7 # 建立子圖物件
 8 ax1 = plt.subplot(2, 2, 1)
 9 ax2 = plt.subplot(2, 2, 2)
10 ax3 = plt.subplot(2, 1, 2)
11
12 # 散點圖
13 ax1.scatter(numpy.random.uniform(1, 11, 100), numpy.random.random(100), color='r', marker='.', label='scatter_label')
14 ax1.set(xlabel='$x$', ylabel='$y$', title='scatter_title')
15 ax1.legend()
16
17 # 盒型圖
18 ax2.boxplot([numpy.arange(10), numpy.arange(10)])
19 ax2.set_xticklabels(['the first', 'the second'], rotation=10)   # 重置座標軸刻度並旋轉
20 ax2.set(ylabel='$y$', title='boxplot_title')
21
22 # 條形圖
23 ax3.bar(numpy.arange(1, 21), numpy.random.random(20), width=0.5, color='g', label='bar_label')
24 ax3.set(xlabel='$x$', ylabel='$y$', title='bar_title')
25 ax3.legend()
26
27 fig.tight_layout()
28 fig.savefig('test_plot.png', dpi=500)
29
30 plt.show()
31 plt.close()
View Code
- 複雜作圖 $\rightarrow$ 3D型別示例:
 1 import numpy
 2 import matplotlib.pyplot as plt
 3 from matplotlib import cm
 4 from matplotlib.ticker import LinearLocator, FormatStrFormatter
 5 from mpl_toolkits.mplot3d import Axes3D                     # 該模組並未直接使用, 但必須匯入, 否則無法識別下面的projection='3d'
 6
 7
 8 # 子圖1的資料 - 一條曲線
 9 theta = numpy.linspace(-4*numpy.pi, 4*numpy.pi, 500)
10 z1 = numpy.linspace(-2, 2, 500)
11 r = z1**2 + 1
12 x1 = r * numpy.sin(theta)
13 y1 = r * numpy.cos(theta)
14
15 # 子圖2的資料 - 一個曲面
16 x2 = numpy.linspace(-5, 5, 100)
17 y2 = numpy.linspace(-5, 5, 100)
18 x2, y2 = numpy.meshgrid(x2, y2)                             # 生成網格
19 length = numpy.sqrt(x2**2 + y2**2)
20 z2 = numpy.sin(length)
21
22 # 建立圖片物件
23 fig = plt.figure(figsize=(8, 4))
24
25 # 建立子圖物件
26 ax1 = plt.subplot(1, 2, 1, projection='3d')                 # projection='3d'標記該子圖為3D子圖
27 ax2 = plt.subplot(1, 2, 2, projection='3d')
28
29 ax1.plot(x1, y1, z1, linewidth=1, label='3d curve')
30 ax1.set(xlim=(-5, 5), ylim=(-5, 5), zlim=(-5, 5),xlabel='$x$', ylabel='$y$', zlabel='$z$', title='curve_title')
31 ax1.legend()
32
33 surf = ax2.plot_surface(x2, y2, z2, cmap=cm.coolwarm, antialiased=False)
34 ax2.set(zlim=(-1.01, 1.01), xlabel='$x$', ylabel='$y$', zlabel='$z$', title='surface_title')
35 # 設定子圖內的軸物件
36 ax2.zaxis.set_major_locator(LinearLocator(10))              # z軸上的總刻度數
37 ax2.zaxis.set_major_formatter(FormatStrFormatter('%.02f'))  # z軸上刻度的格式
38
39 fig.colorbar(surf, shrink=0.5, aspect=10)                   # 展示顏色棒
40
41 fig.tight_layout()
42 fig.savefig('test_plot.png', dpi=500)
43
44 plt.show()
45 plt.close()
View Code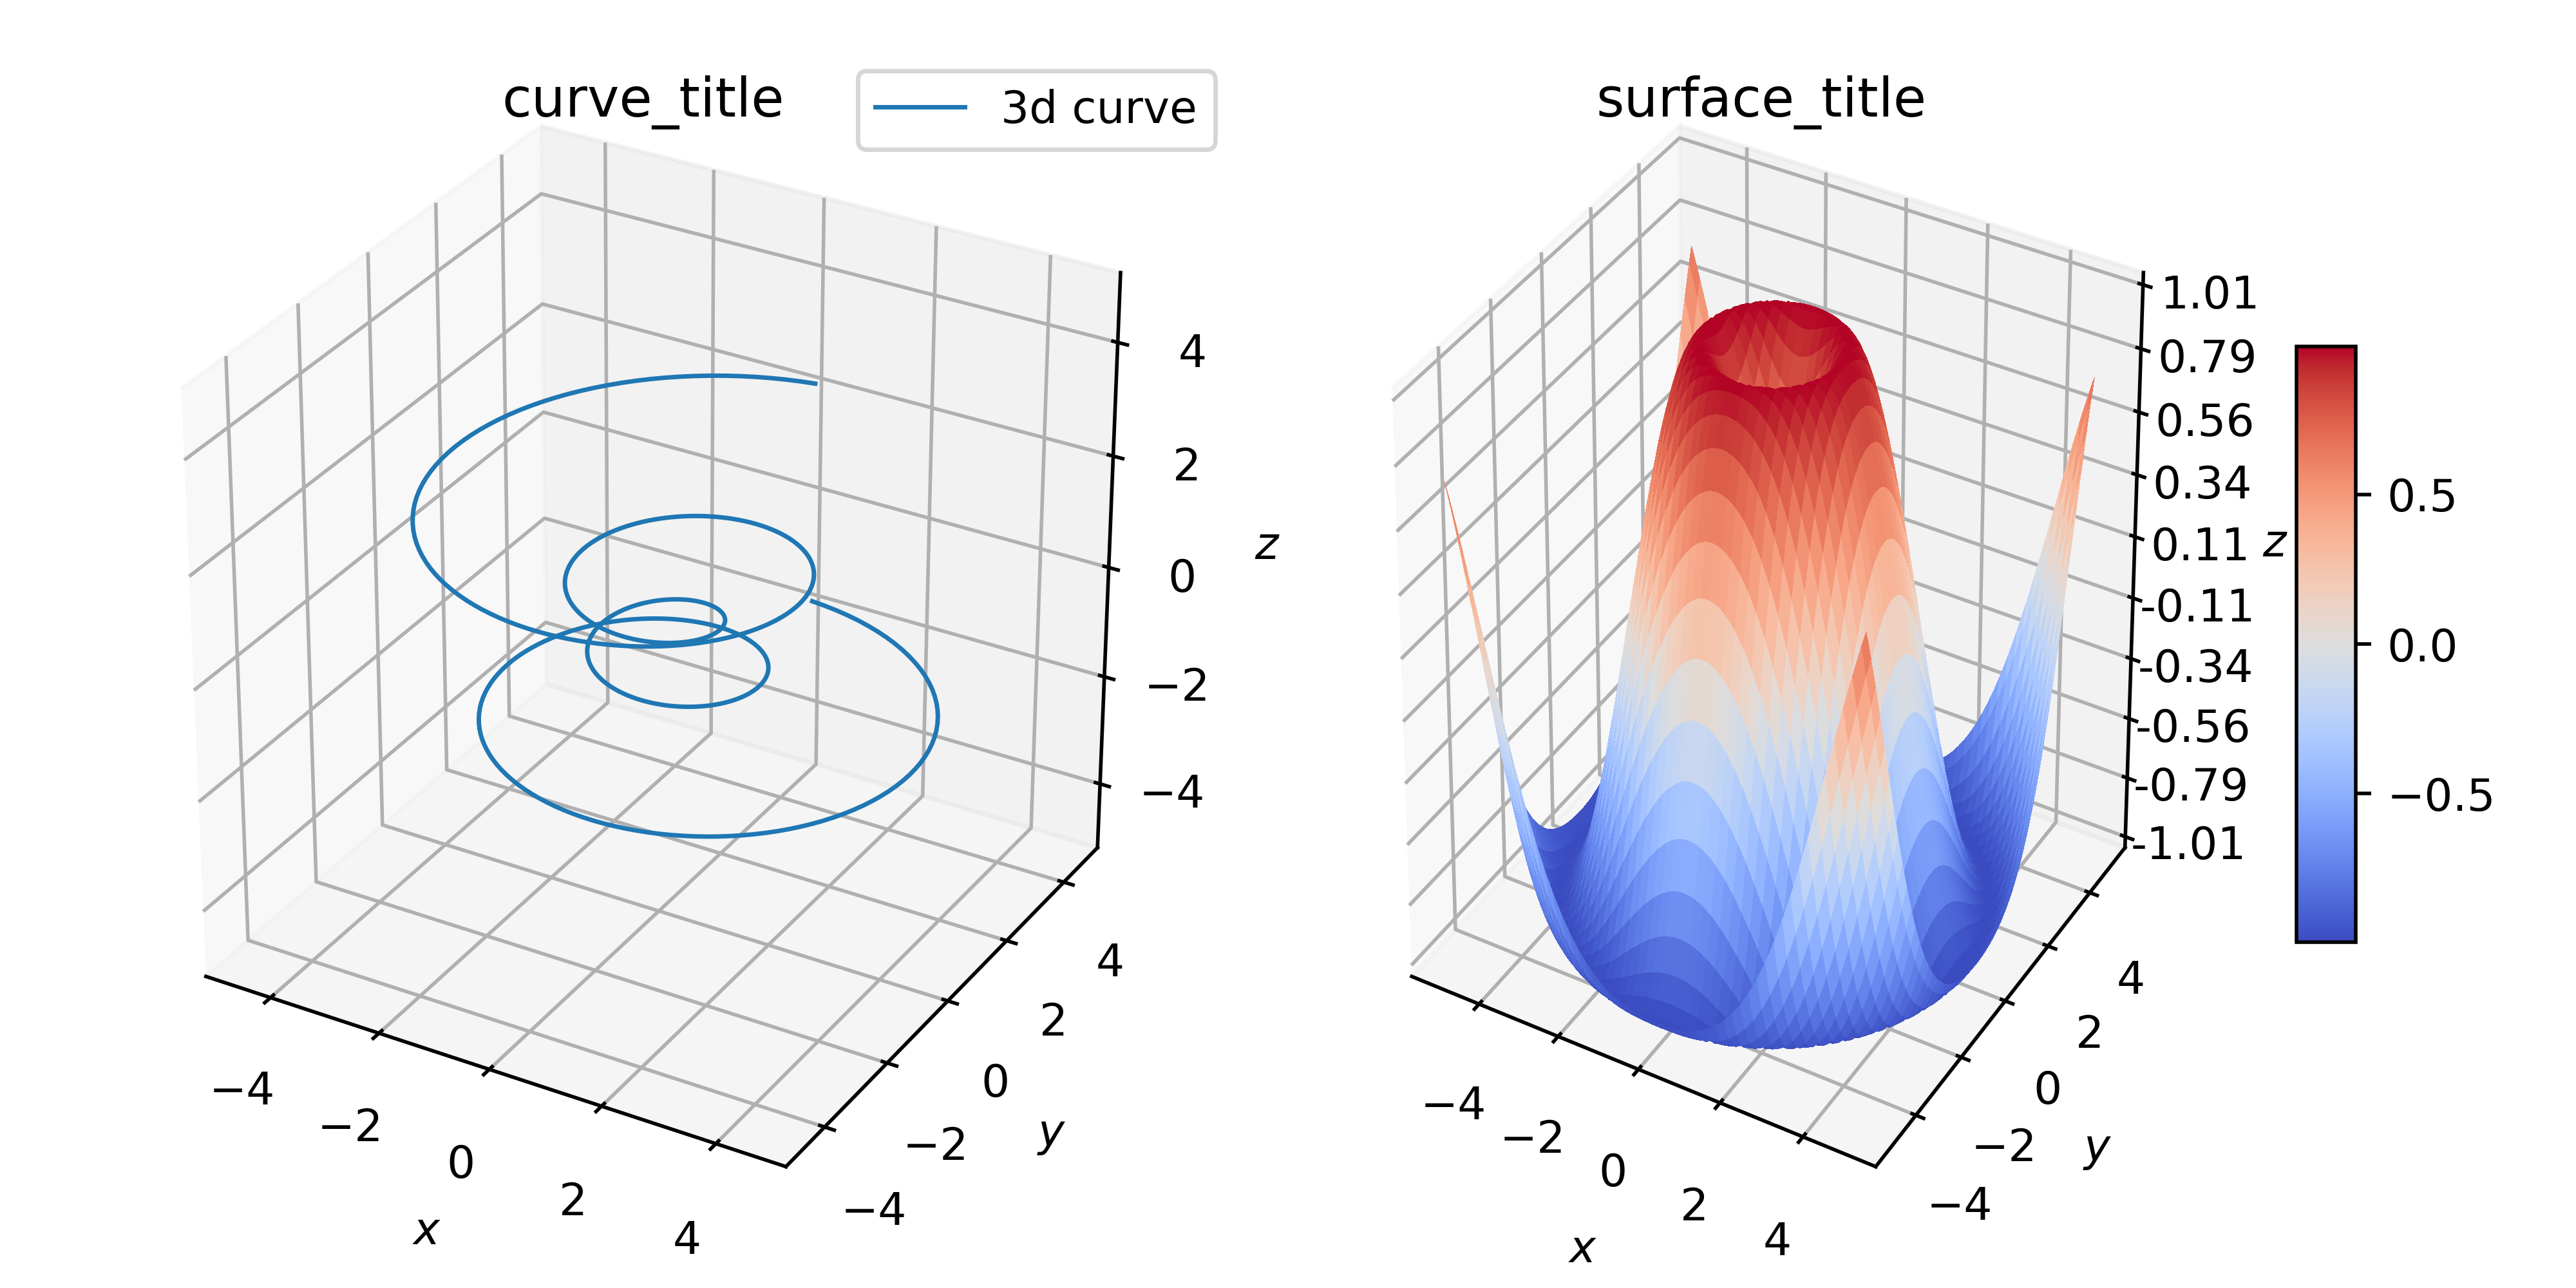
- 參考:
https://matplotlib.org/api/_as_gen/matplotlib.pyplot.subplots.html#matplotlib.pyplot.subplots
https://matplotlib.org/api/_as_gen/matplotlib.axes.Axes.plot.html#matplotlib.axes.Axes.plot
https://matplotlib.org/tutorials/toolkits/mplot3d.html