Matlab中插值函式彙總和使用說明
注:該文從連結地址http://blog.sciencenet.cn/blog-457143-679275.html轉載。
MATLAB中的插值函式為interp1,其呼叫格式為: yi= interp1(x,y,xi,’method’)
其中x,y為插值點,yi為在被插值點xi處的插值結果;x,y為向量, ‘method’表示採用的插值方法,MATLAB提供的插值方法有幾種: ‘method’是最鄰近插值, ‘linear’線性插值; ‘spline’三次樣條插值; ‘cubic’立方插值.預設時表示線性插值
注意:所有的插值方法都要求x是單調的,並且xi不能夠超過x的範圍。
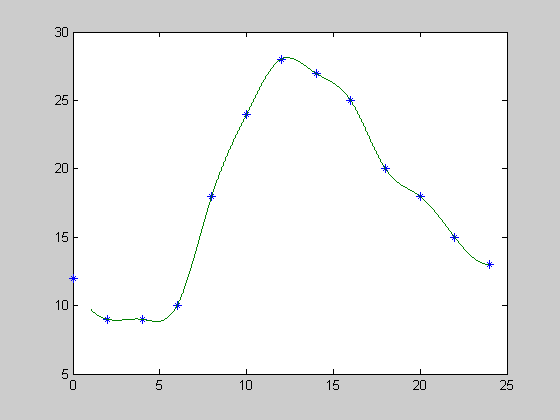
例如:在一 天24小時內,從零點開始每間隔2小時測得的環境溫度資料分別為
12,9,9,10,18 ,24,28,27,25,20,18,15,13,
推測中午12點(即13點)時的溫度.
x=0:2:24; y=[12 9 9 10 18 24 28 27 25 20 18 15 13];
a=13; y1=interp1(x,y,a,’spline’)
結果為: 27.8725
若要得到一天24小時的溫度曲線,則:
xi=0:1/3600:24;
yi=interp1(x,y,xi, ‘spline’);
plot(x,y,’o’ ,xi,yi)

-
>>x = 0:10; y = x.*sin(x);
-
>>xx = 0:.25:10; yy = interp1(x,y,xx);
-
>>plot(x,y,’kd’,xx,yy)
-
>> year = 1900:10:2010;
-
>> product = [75.995 91.972 105.711 123.203 131.669 150.697 179.323 203.212 226.505
-
249.633 256.344 267.893 ];
-
>>p1995 = interp1(year,product,1995)
-
>>x = 1900:1:2010;
-
>>y = interp1(year,product,x,’pchip’);
-
>>plot(year,product,’o’,x,y)
-
p1995 =
-
252.9885
-
>>[X,Y] = meshgrid(-3:.25:3);
-
>>Z = peaks(X,Y);
-
>>[XI,YI] = meshgrid(-3:.125:3);
-
>>ZZ = interp2(X,Y,Z,XI,YI);
-
>>surfl(X,Y,Z);hold on;
-
>>surfl(XI,YI,ZZ+15)
-
>>axis([-3 3 -3 3 -5 20]);shading flat
-
>>hold off
-
>>years = 1950:10:1990;
-
>>service = 10:10:30;
-
>>wage = [150.697 199.592 187.625
-
179.323 195.072 250.287
-
203.212 179.092 322.767
-
226.505 153.706 426.730
-
249.633 120.281 598.243];
-
>>w = interp2(service,years,wage,15,1975)
-
w =
-
190.6288
-
>>[x,y,z,v] = flow(20);
-
>>[xx,yy,zz] = meshgrid(.1:.25:10, -3:.25:3, -3:.25:3);
-
>>vv = interp3(x,y,z,v,xx,yy,zz);
-
>>slice(xx,yy,zz,vv,[6 9.5],[1 2],[-2 .2]); shading interp;colormap cool
-
>>x = [0 2 4 5 8 12 12.8 17.2 19.9 20]; y = exp(x).*sin(x);
-
>>xx = 0:.25:20;
-
>>yy = spline(x,y,xx);
-
>>plot(x,y,’o’,xx,yy)
-
[X,Y] = meshgrid(1:3,10:14)
-
X =
-
1 2 3
-
1 2 3
-
1 2 3
-
1 2 3
-
1 2 3
-
Y =
-
10 10 10
-
11 11 11
-
12 12 12
-
13 13 13
-
14 14 14
-
>>tab = [(1:4)’ hilb(4)]
-
>>y = table1(tab,[1 2.3 3.6 4])
-
>>tab = [(1:4)’ hilb(4)]
-
>>y = table1(tab,[1 2.3 3.6 4])
