效能監控之Telegraf+InfluxDB+Grafana伺服器實時監控
阿新 • • 發佈:2018-12-09
文章目錄
引言
JMeter的PerfMonMetricsCollector
目標
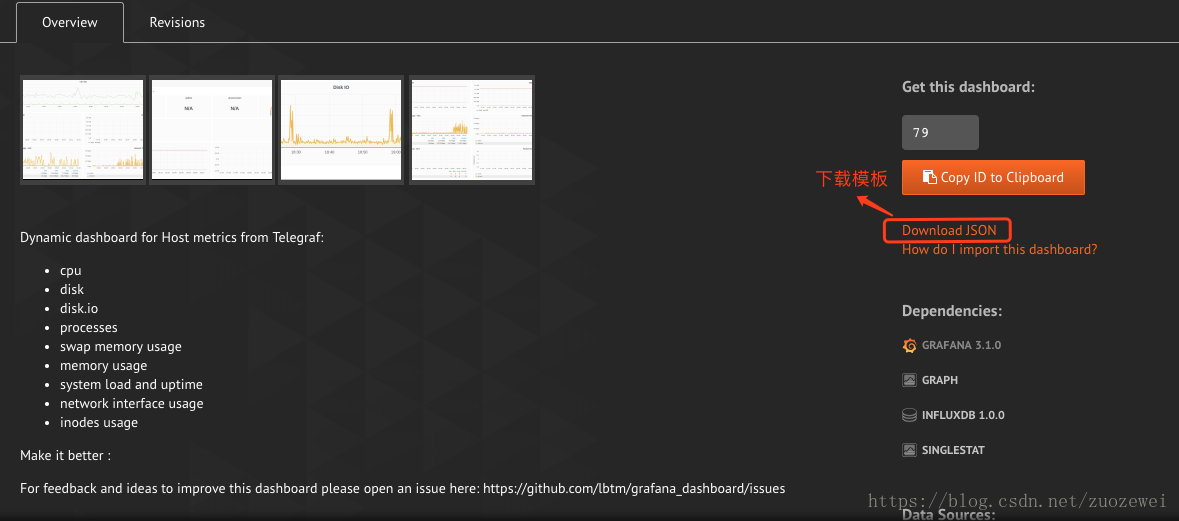
收集Linux APP伺服器的效能指標:
- List item
- cpu
- disk
- disk.io
- processes
- swap memory usage
- memory usage
- system load and uptime
- network interface usage
- inodes usage
解決方案
Telegraf
除非我自己修改JMeter原始碼,否則JMeter不會把收集的效能資料持久化到資料庫的,但這樣的成本太高,因此,我們選擇更簡單成本低的Telegraf作為採集服務。
Telegraf 是一個用 Go 編寫的代理程式,可收集系統和服務的統計資料,並寫入到InfluxDB 資料庫。Telegraf 具有記憶體佔用小的特點,通過外掛系統可輕鬆新增支援其他服務的擴充套件。
TICK家族
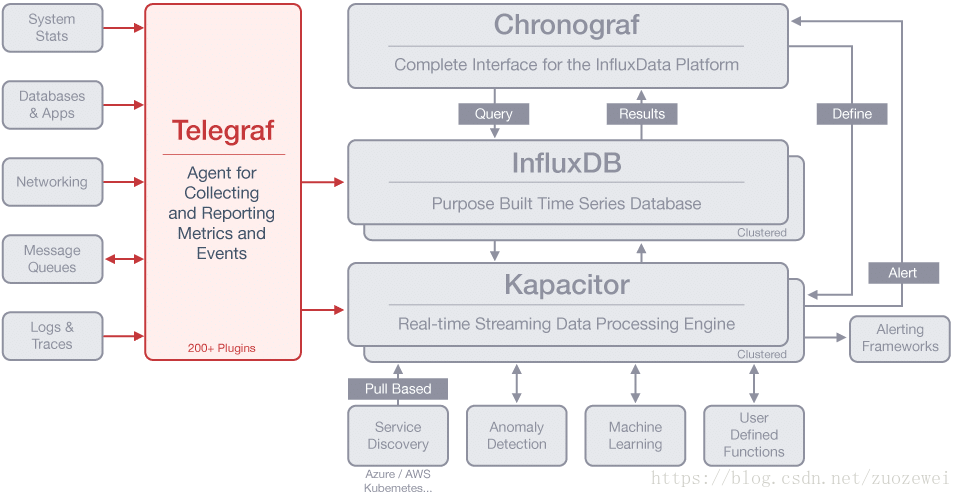
官網地址:https://www.influxdata.com/time-series-platform/telegraf/
整體設計
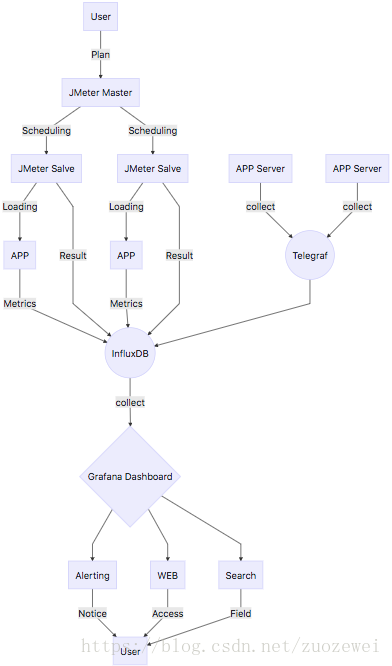
Telegraf&InfluxDB整合
下載安裝
[[email protected] ~]# wget https://dl.influxdata.com/telegraf/releases/telegraf-1.7.4-1.x86_64.rpm
[[email protected] ~]# yum localinstall telegraf-1.7.4-1.x86_64.rpm
建立influxDB使用者和資料庫
[[email protected] ~]# influx
Connected to http://localhost:8086 version 1.6.2
InfluxDB shell version: 1.6.2
> create user "telegraf" with password 'telegraf'
> create database telegraf
> show databases
name: databases
name
----
_internal
jmeter
demo
test
7dgroup
telegraf
> exit
配置Telegraf
[[email protected] ~]# vim /etc/telegraf/telegraf.conf
# Configuration for sending metrics to InfluxDB
[[outputs.influxdb]]
  ## The full HTTP or UDP URL for your InfluxDB instance.
  urls = ["http://127.0.0.1:8086"]

  ## The target database for metrics; will be created as needed.
  database = "telegraf"

  ## Name of existing retention policy to write to.  Empty string writes to
  ## the default retention policy.  Only takes effect when using HTTP.
   retention_policy = ""

  ## Timeout for HTTP messages.
   timeout = "5s"

  ## HTTP Basic Auth
  username = "telegraf"
  password = "telegraf"
啟動Telegraf
[[email protected] ~]# systemctl start telegraf
檢視資料
[[email protected] ~]# influx
Connected to http://localhost:8086 version 1.6.2
InfluxDB shell version: 1.6.2
> use telegraf
Using database telegraf
> show measurements
> show measurements
name: measurements
name
----
cpu
disk
diskio
kernel
mem
processes
swap
system
效能資料已經成功儲存~
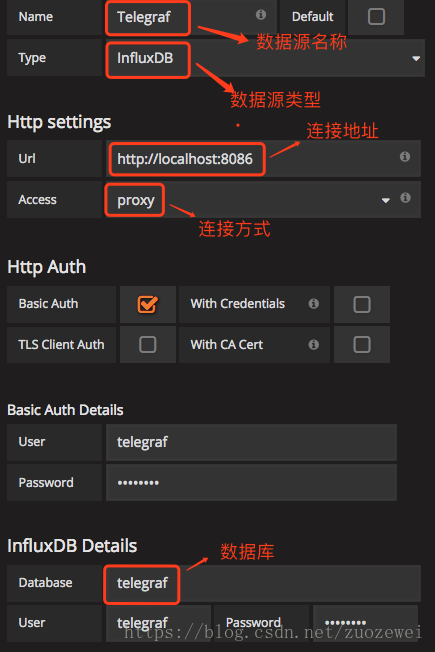
InfluxDB&Grafana整合
Grafana新建資料來源
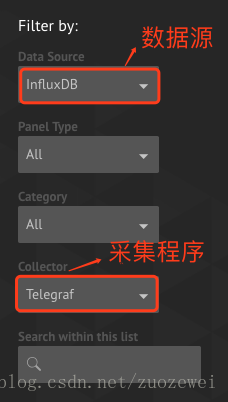
下載看板模板
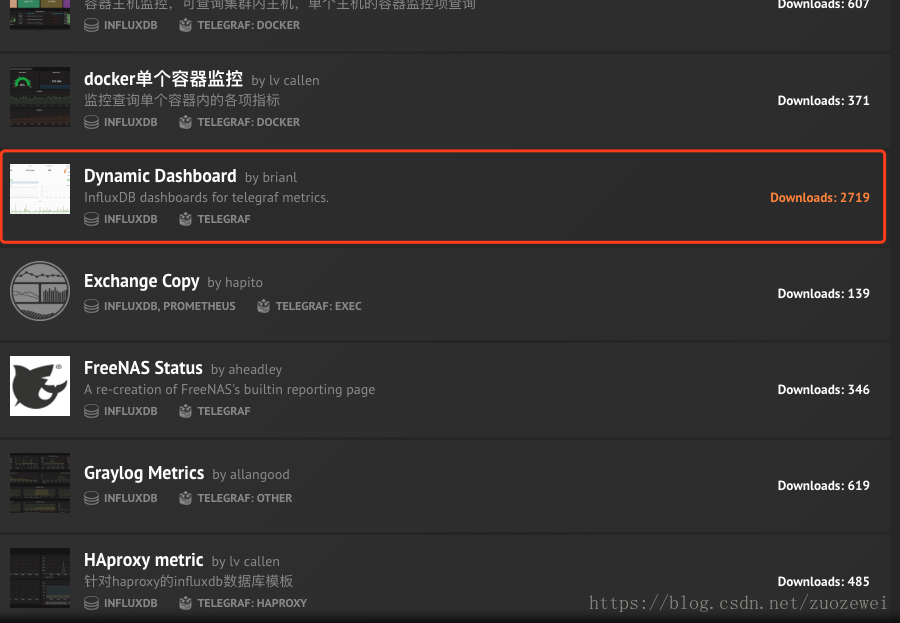
搜尋看板模板
官方看板模板庫:https://grafana.com/dashboards
選擇需要下載的看板模板
下載看板模板
此看板地址:https://grafana.com/dashboards/79
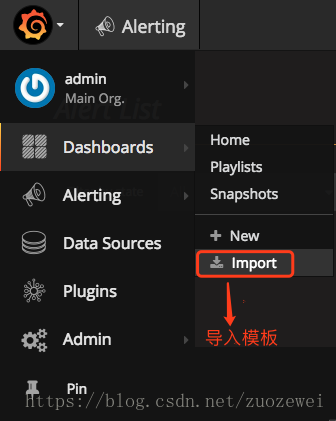
Grafana匯入模板
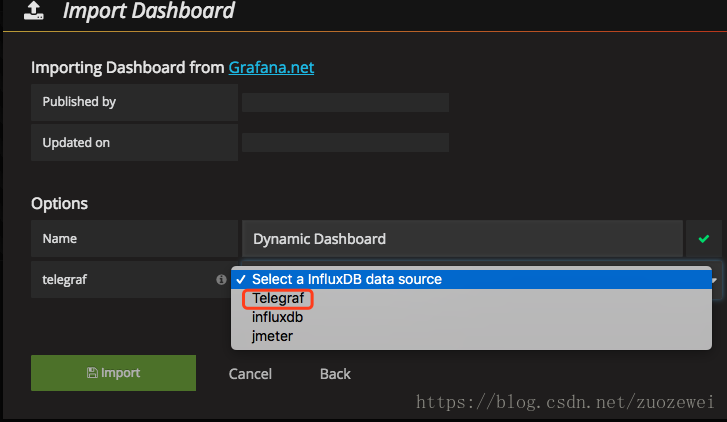
選擇Telegraf資料來源
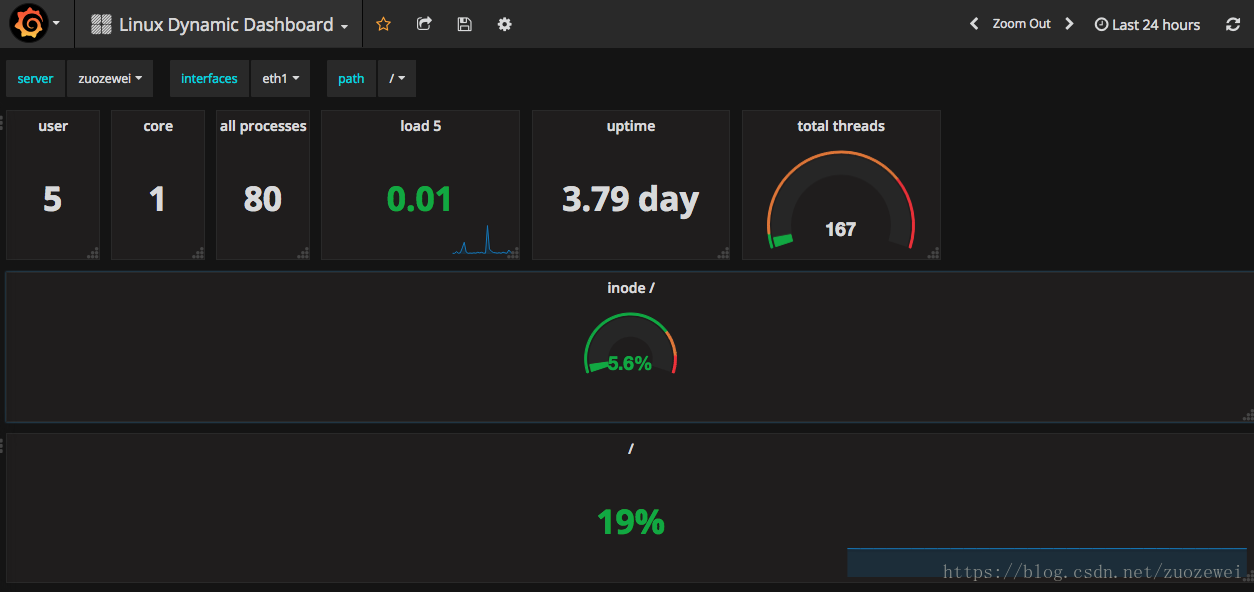
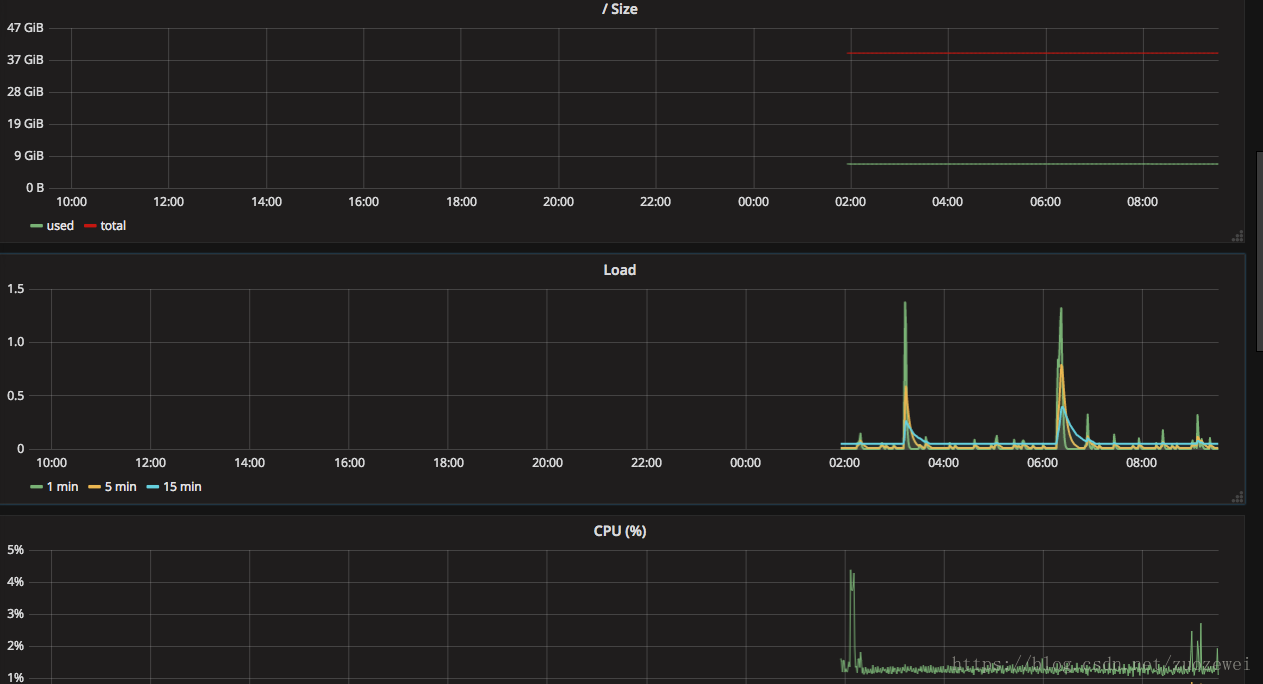
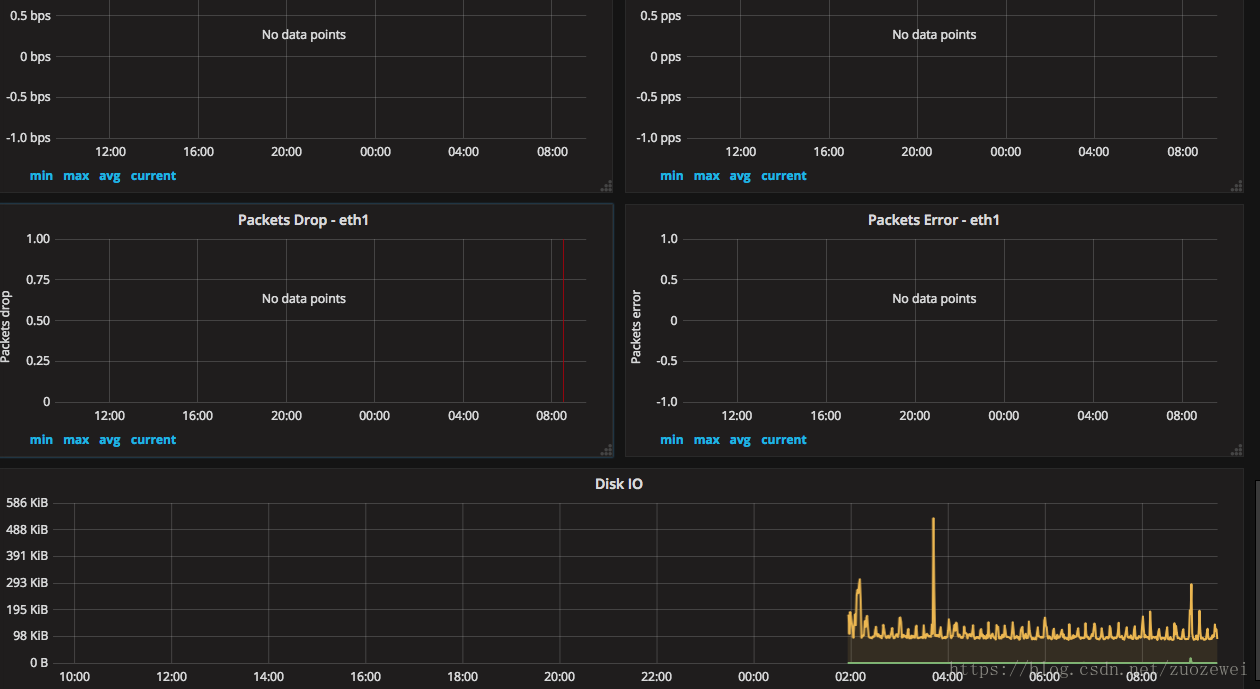
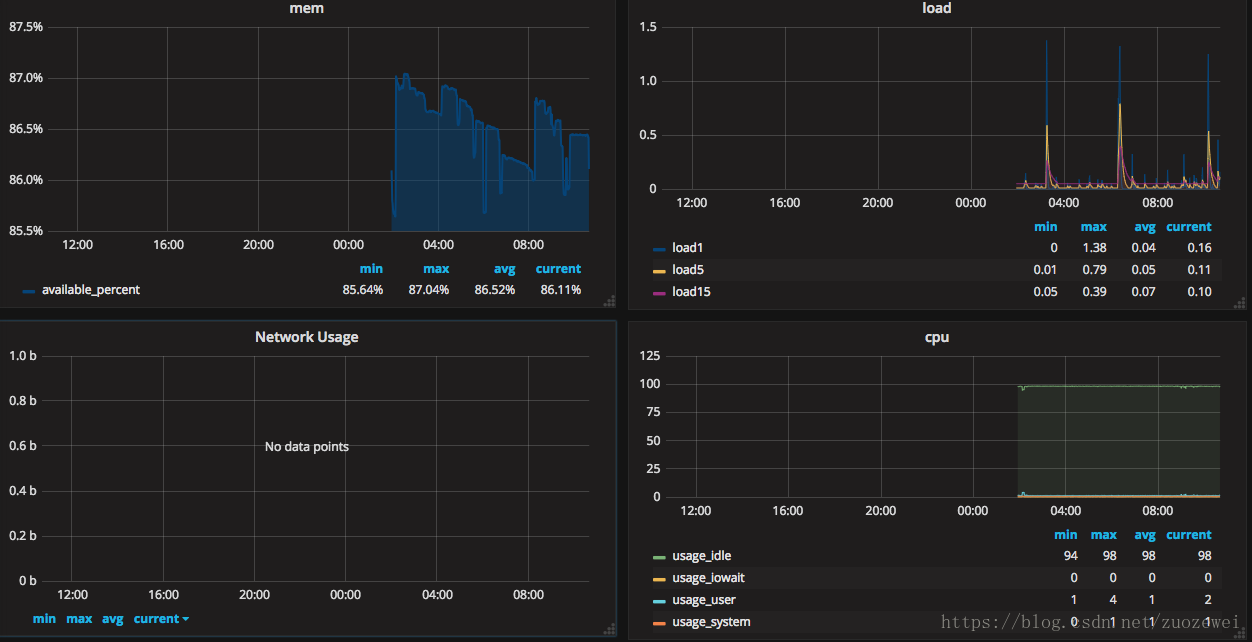
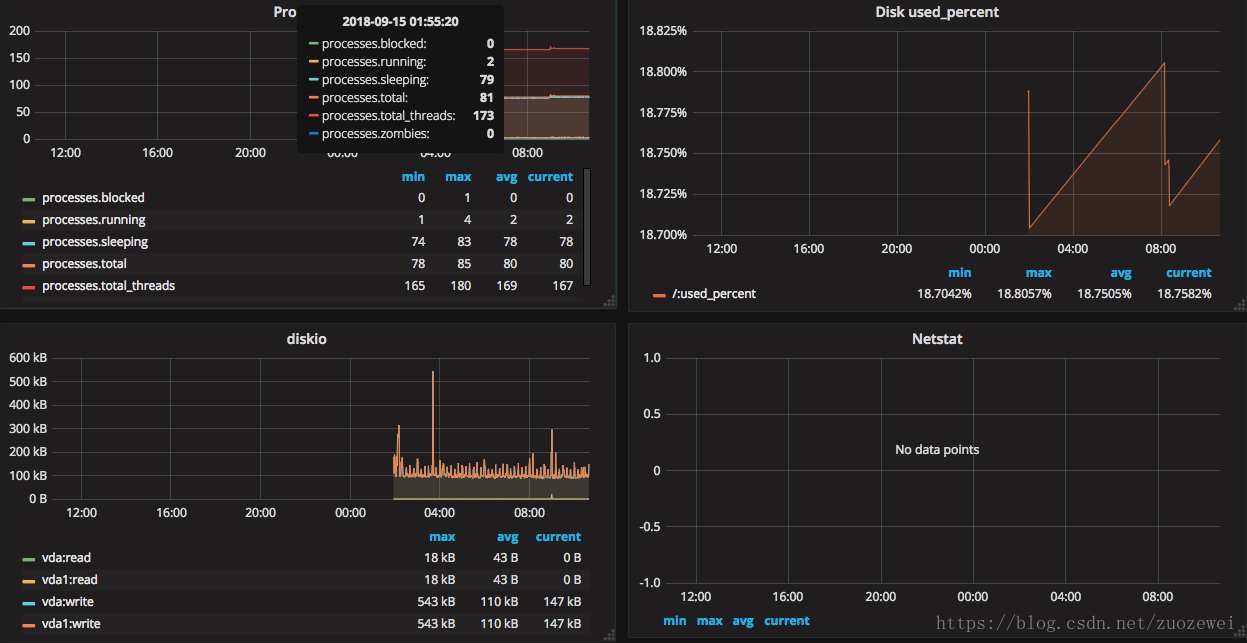
最後來張監控效果高清大圖
其他看板模板效果圖