
R語言——學習筆記(二)
1.用R語言匯入Excel檔案中“xlsx”和“xls”格式的資料。
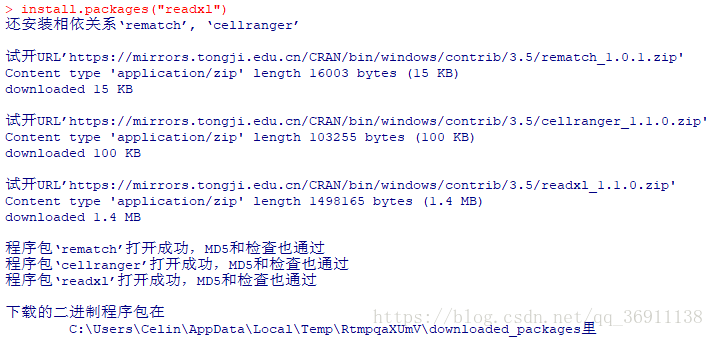
(1)安裝“readxl”包:
>install.packages("readxl")
(2)將Excel資料匯入R中,檔案位於“C:\Users\Celin\Desktop”路徑的“breads.xlsx”中:
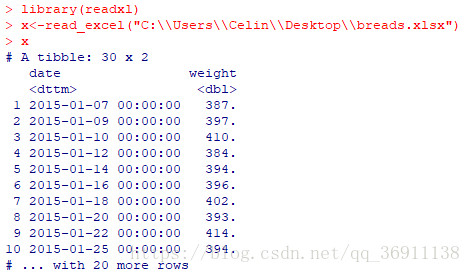
>library(readxl)
>x<-read_excel("C:\\Users\\Celin\\Desktop\\breads.xlsx")
>x
(3)其他方法:彈出檔案對話方塊,選取資料檔案。
>x<-read_excel(file.choose())
2.mean() 函式,計算平均值
例:>mean(x$weight)
3.sd() 函式,計算標準差
例:>sd(x$weight)
4.t.test() 函式,進行均值差異檢驗
例:>t.test(x$weight,mu=400) mu=400,指定總體均值

5.運用ggplot2程式包繪製直方圖。
alpha指透明度,colour指輪廓色,fill指填充色,binwidth指組距,xlab指x軸名字,ylab指y軸名字,ggtitle指表名
geom_histogram指直方圖,geom_point指點圖,geom_line指折線圖,geom_bar指條形圖,geom_boxplot指箱線圖,
geom_density指曲線密度圖……
例:> library(ggplot2)
> ggplot(x,aes(x=weight))+geom_histogram(binwidth=10,fill="steelblue",colour="black",alpha=0.5)+xlab("麵包的重量")+ylab("個數")+ggtitle("麵包資料的直方圖")
