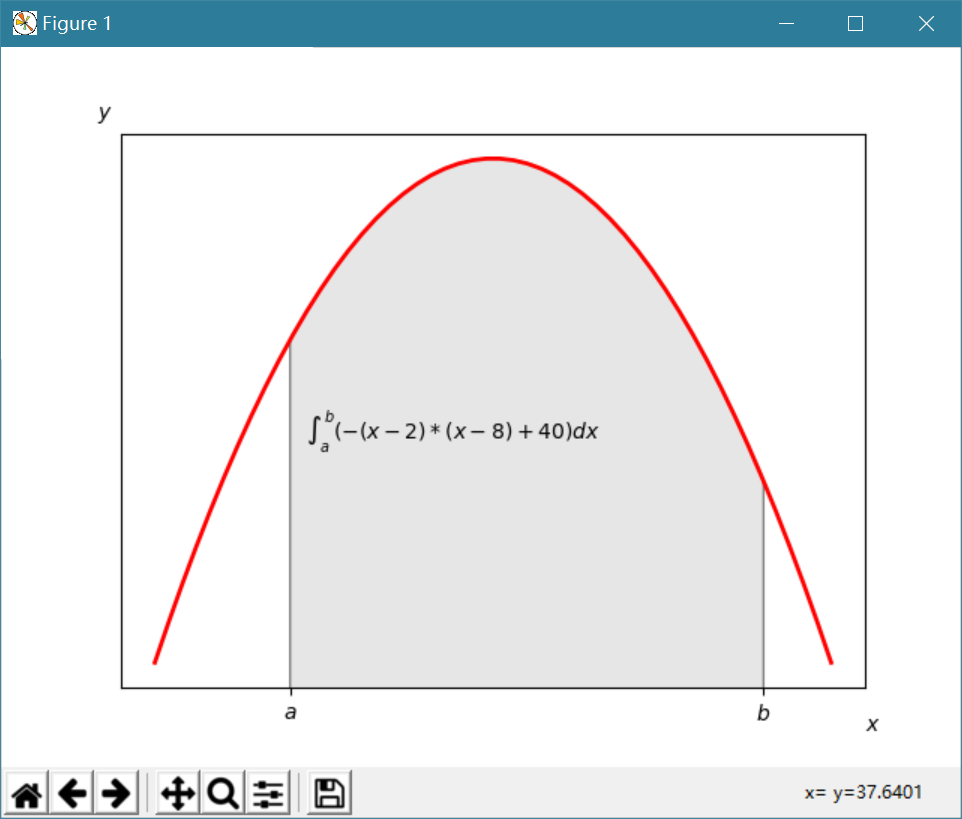
Python學習筆記(matplotlib實戰篇)--函式積分圖
阿新 • • 發佈:2018-12-10
Python學習筆記--極座標
所用的庫及環境:
IDE:Pycharm
Python環境:python3.7
Matplotlib: Matplotlib 1.11
Numpy: Numpy1.15
函式積分圖
- 程式碼及效果圖
1 import matplotlib.pyplot as plt 2 import numpy as np 3 from matplotlib.patches import Polygon 4 5 def func(x): 6 return -(x-2)*(x-8)+40 7 8 x = np.linspace(0,10)9 y = func(x) 10 11 fig,axes = plt.subplots() 12 #繪製曲線 13 plt.plot(x,y,'r',linewidth = 2) 14 a=2 15 b=9 16 17 #座標軸設定 18 axes.set_xticks([a,b]) 19 axes.set_xticklabels(['$a$','$b$']) 20 axes.set_yticks([]) 21 plt.figtext(0.9,0.05,'$x$') 22 plt.figtext(0.1,0.9,'$y$') 23 24 #繪製灰色多邊形 25 ix=np.linspace(a,b)26 iy=func(ix) 27 ixy = zip(ix,iy) 28 verts=[(a,0)]+list(ixy)+[(b,0)] 29 poly = Polygon(verts,facecolor='0.9',edgecolor='0.5') 30 axes.add_patch(poly) 31 32 #新增數學公式 33 x_math =(a+b)*0.5*0.8 34 y_math = 35 35 plt.text(x_math,y_math,'$\int_a^b(-(x-2)*(x-8)+40)dx$',fontsize=10,horizontalalignment='center') 36 plt.show()

三.結語:
感謝matplotlib,numply提供的文件,感謝麥子學院提供的視訊教學
文章如哪裡有誤請聯絡作者QQ406802063,及時更正,感謝
