
如何愉快的在PhpStorm中進行Xdebug斷點除錯?
阿新 • • 發佈:2018-12-14
前言
- 如果你厭煩了
print_r、log、var_dump這類一次除錯一行的方式 - 如果你的業務複雜到一層又套一層,打 log 都救不了你的思路
- 如果你瞭解斷點除錯,但是還沒有在
PhpStorm中配置過 - 如果你想在
前端頁面 按選單或按鈕 呼叫API時,斷點除錯後端程式碼 - 如果你想在
Postman訪問 API 時,斷點除錯後端程式碼
參考文件
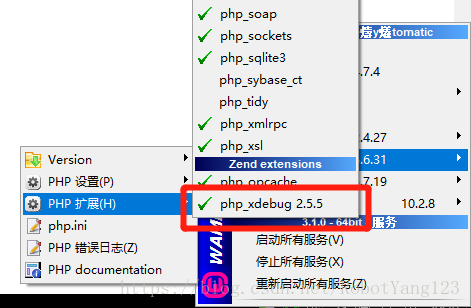
PHP 安裝 Xdebug 模組
Windows
- 這裡我用的是
Wamp3.1.0_x64,已經預設安裝了php_xdebug,其他環境的 php_xdebug 安裝請自行百度哈 - 因此只需要將
xdebug.remote_enable = On啟用,如 Wamp3.1.0_x64 中 PHP 5.6 的php.ini的xdebug配置如下
; XDEBUG Extension
[xdebug]
zend_extension ="C:/Users/robot/Program/Wamp/Wamp3.1.0_64/bin/php/php5.6.31/zend_ext/php_xdebug-2.5.5-5.6-vc11-x86_64.dll"
xdebug.remote_enable = On
xdebug.profiler_enable = off
xdebug.profiler_enable_trigger = off
xdebug.profiler_output_name = cachegrind.out.%t.%p
xdebug.profiler_output_dir ="C:/Users/robot/Program/Wamp/Wamp3.1.0_64/tmp"
xdebug.show_local_vars=0
- 1
- 2
- 3
- 4
- 5
- 6
- 7
- 8
- 9
Linux
Ubuntu
- 安裝 xdebug 模組
sudo apt-get install php-xdebug
- 檢視所有模組
php -m
- 查詢 xdebug 安裝後的擴充套件路徑
find /usr/ -name 'xdebug.so'/usr/lib/php/20151012/xdebug.so
- 查詢 php.ini 所在路徑
php -i|grep 'php.ini'/etc/php/7.0/cli/php.ini
- 編輯 xdebug 配置
[xdebug]
zend_extension="/usr/lib/php/20151012/xdebug.so"
xdebug.remote_enable=1
//xdebug.remote_handler=dbgp
//xdebug.remote_mode=req
//xdebug.remote_host=127.0.0.1
//xdebug.remote_port=9000
- 1
- 2
- 3
- 4
- 5
- 6
- 7
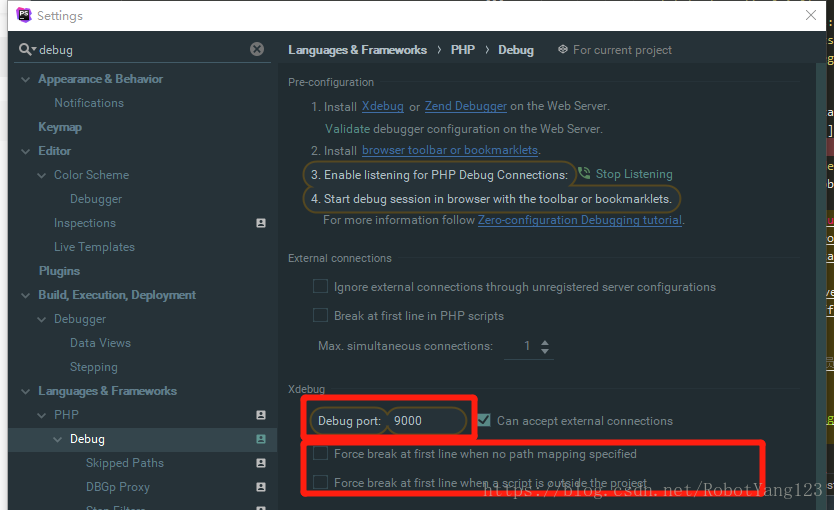
PhpStorm 配置 debug connections 服務
- 在工具欄中選擇 File -> setting
- 搜尋關鍵詞 debug,選擇 Languages & Frameworks 下的 PHP -> Debug
- 配置預設
埠 9000 - 取消強制中斷
- 配置預設
配置與除錯
- 多種除錯配置方式:本質都是在
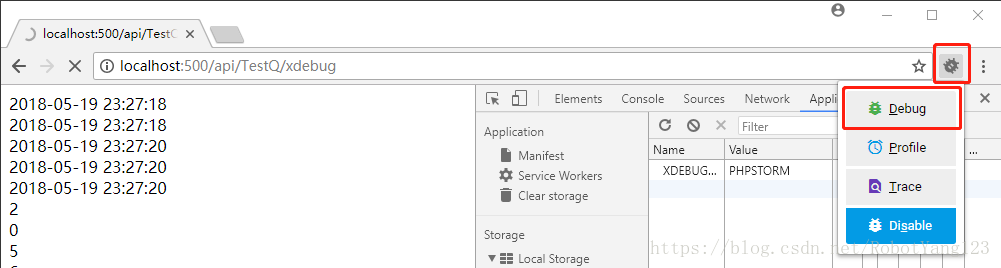
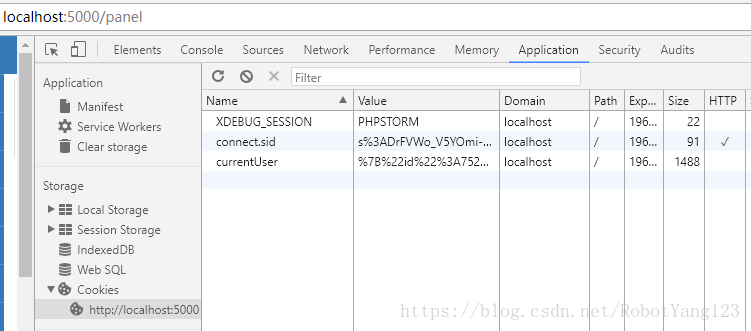
cookie中自動新增XDEBUG_SESSION=PHPSTORM- 使用
瀏覽器Xdebug Helper外掛設定idekey,用 debug 啟動訪問時,然後 cookie 會自動新增XDEBUG_SESSION - 使用
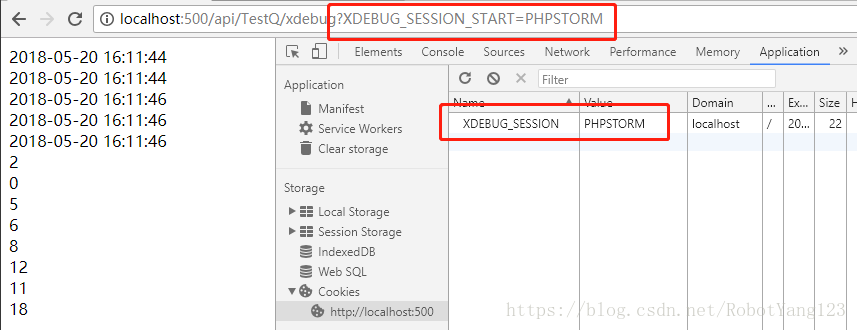
請求體 request中設定XDEBUG_SESSION_START=PHPSTORM請求引數,然後 cookie 會自動新增XDEBUG_SESSION- 在請求的
URL後追加,如http://localhost:500/api/TestQ/xdebug?XDEBUG_SESSION_START=PHPSTORM - 在請求的
body中追加,如request.body.XDEBUG_SESSION_START=PHPSTORM
- 在請求的
- 使用
PhpStorm配置Debug Configuration 與 Servers,用 PhpStorm debug 啟動訪問時,URL會自動追加XDEBUG_SESSION_START 請求引數,然後 cookie 會自動新增XDEBUG_SESSION
- 使用
瀏覽器 Xdebug Helper 外掛方式
優缺介紹
- 優點:
- 無需 PhpStorm 配置 Debug Configuration 與 Servers
- 只要配置一致的
idekey=PHPSTORM或在 cookie 中新增XDEBUG_SESSION=PHPSTORMXdebug Helper配置idekey=PHPSTORM後,在啟用 debug 模式時,會自動在當前訪問 url 所在域名(如 localhost:500)下的 cookie 中新增XDEBUG_SESSION=PHPSTORM前端只需要任意頁面啟用 Xdebug Helper 的 debug 模式即可,原理如上(但要確認你的 client request 攜帶的 cookie 可以正確到達 server requestPostman只需要指定域名(如 localhost)的cookie中新增一次XDEBUG_SESSION=PHPSTORM即可PhpStorm中只需開啟Listening Debug Connections(就是頂部路徑欄中右邊那個小電話圖示)
- 缺點:
- 需要安裝 Xdebug Helper
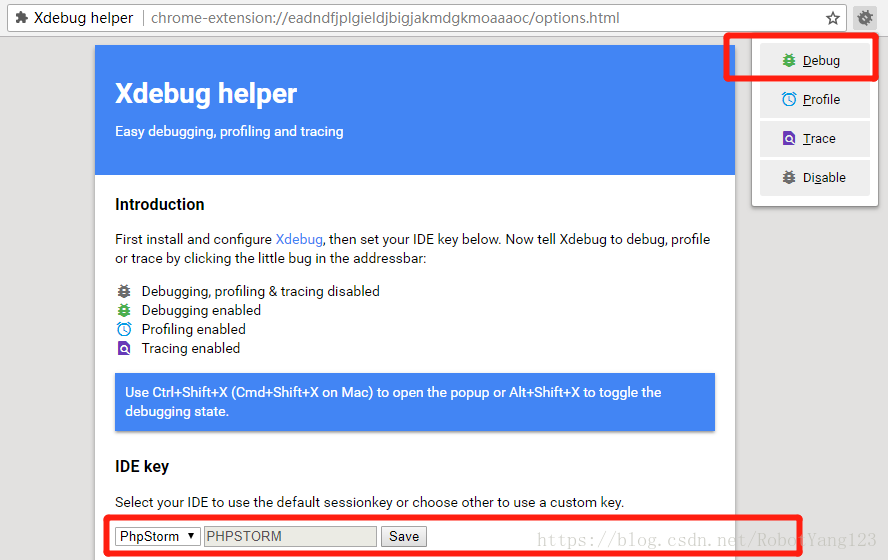
安裝 Xdebug helper 外掛
- 下載
Xdebug helper外掛的crx檔案,在瀏覽器擴充套件程式中拖放安裝即可 - 配置外掛選項,在外掛上右鍵選單選擇“選項”,配置
idekey如下
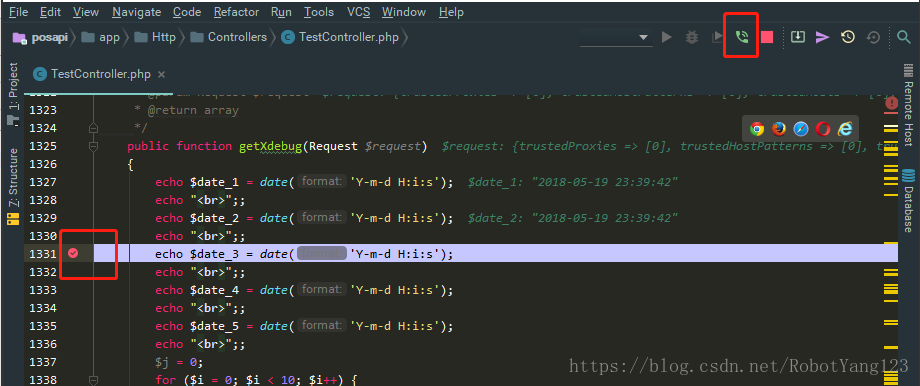
啟用測試斷點除錯
- PhpStorm
- 在 PhpStorm 中啟動你的
小電話 - 設定斷點
- 在 PhpStorm 中啟動你的
-
瀏覽器 URL / 前端 URL(啟動 Xdebug helper 外掛的
debug 模式)- 然後訪問你的除錯檔案 或者 API 地址
-
Postman URL
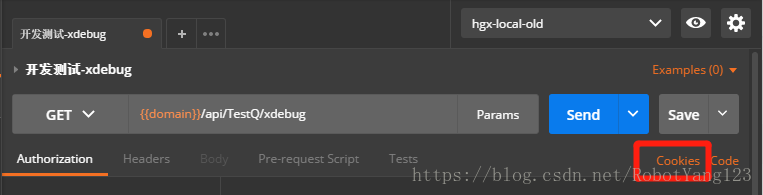
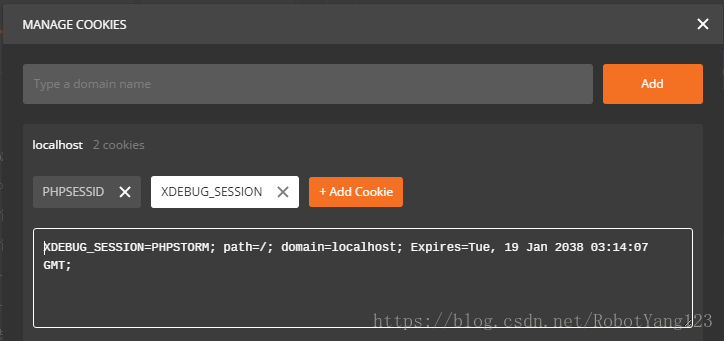
- 在指定域名(如 localhost)的
cookie中新增一次XDEBUG_SESSION=PHPSTORM
- 在指定域名(如 localhost)的
-
前端 node.js / express.js 等
- 按上面的邏輯,應該是在 cookie 中新增
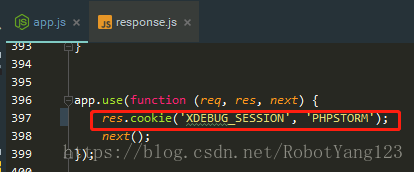
XDEBUG_SESSION=PHPSTORM,如response.cookie('XDEBUG_SESSION', 'PHPSTORM'); - 我這裡用的是
node.js + express.js直接在app.js中全域性注入了 XDEBUG_SESSION 的 cookie - 雖然瀏覽器控制檯的 Application 也顯示 XDEBUG_SESSION 的 cookie 被正確寫入
- 然後後臺 API 卻沒有收到該 cookie,所以 PhpStorm 的 debug 也沒有生效,原因待查……
- 按上面的邏輯,應該是在 cookie 中新增
請求體 request 中通過 XDEBUG_SESSION_START 請求引數 方式
優缺介紹
- 優點:
- 無需安裝 Xdebug Helper
- 無需 PhpStorm 配置 Debug Configuration 與 Servers
- 缺點:
- 需要在 request body 或 當前 URL 後追加
XDEBUG_SESSION_START=PHPSTORM請求引數
- 需要在 request body 或 當前 URL 後追加
PhpStorm 配置 debug connections 服務
- 與前文一致
啟用測試斷點除錯
-
PhpStorm
- 與前文一致
-
瀏覽器 URL / 前端 URL
- 關閉 Xdebug helper 外掛,即切換到
Disable 模式;或者直接解除安裝 - 在當前訪問的 URL 後追加
?XDEBUG_SESSION_START=PHPSTORM
- 關閉 Xdebug helper 外掛,即切換到
-
Postman URL
- 在當前訪問的 URL 後追加
?XDEBUG_SESSION_START=PHPSTORM
- 在當前訪問的 URL 後追加
-
前端 node.js / express.js 等
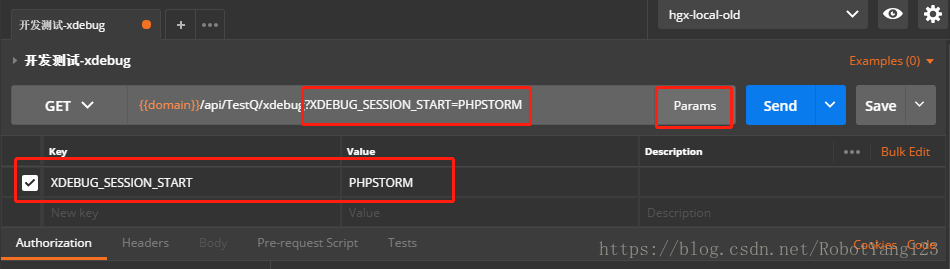
- 在 request body 中追加請求引數
XDEBUG_SESSION=PHPSTORM,如request.body.XDEBUG_SESSION_START='PHPSTORM'
- 在 request body 中追加請求引數
PhpStorm 配置 Debug Configuration 與 Servers 方式
優缺介紹
- 優點:
- 無需安裝 Xdebug Helper
- 無需在 request body 或 當前 URL 後追加
XDEBUG_SESSION_START=PHPSTORM請求引數
- 缺點:
- 需要在
PhpStorm中配置 Debug Configuration 與 Servers - 配置完 PhpStorm 後,需要點選右上角的
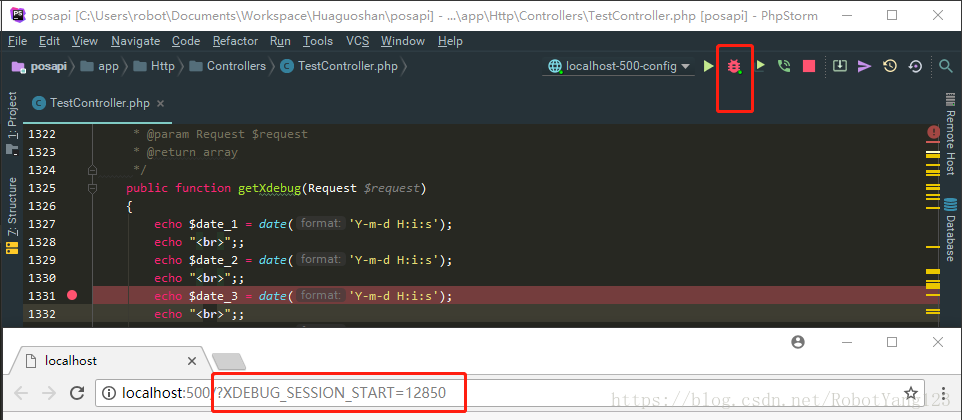
甲殼蟲圖示,獲取除錯用的XDEBUG_SESSION_START=session_key
- 需要在
在 PhpStorm 中配置 Debug Configuration 與 Servers
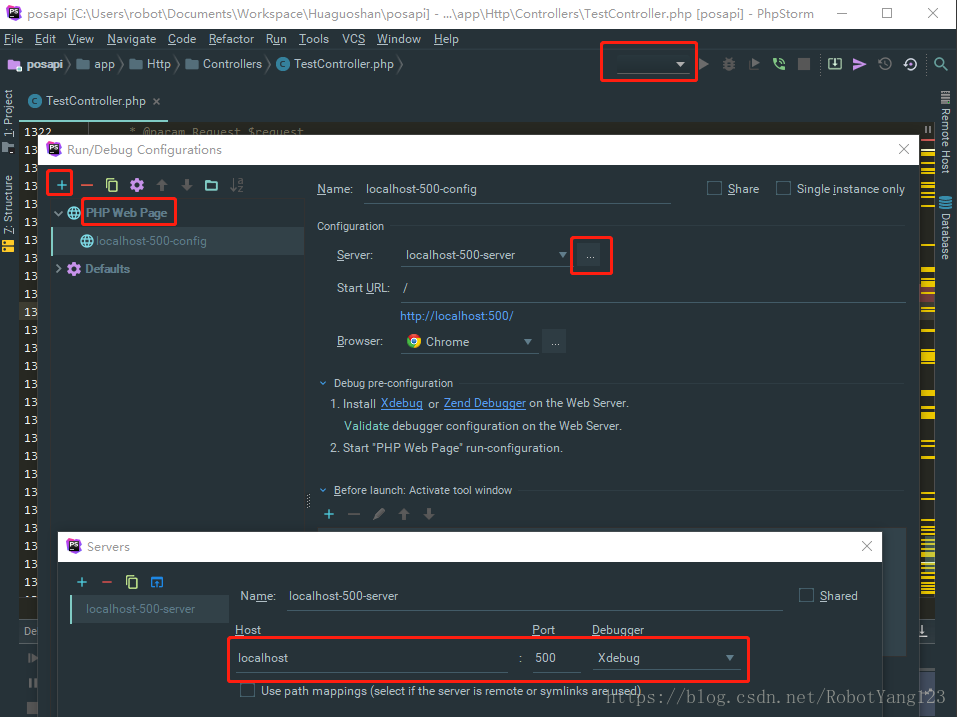
- 點選右上角,選擇
Edit Configurations - 點選
+ 號,新增一個 PHP Web Page - 點選 Server 右邊的那個
...,先新建一個 Web 服務 - 然後點選右上角的
甲殼蟲圖示,獲取除錯用的XDEBUG_SESSION_START=session_key - 複製這一對
XDEBUG_SESSION_START=12850,之後就是和《請求體 request 中通過 XDEBUG_SESSION_START 請求引數 方式》介紹的操作一樣啦,這裡不再贅述。 - 所以網路上的這一種除錯方式相對繁瑣多餘,目前我也不知道有何意義。
檢視斷點資訊
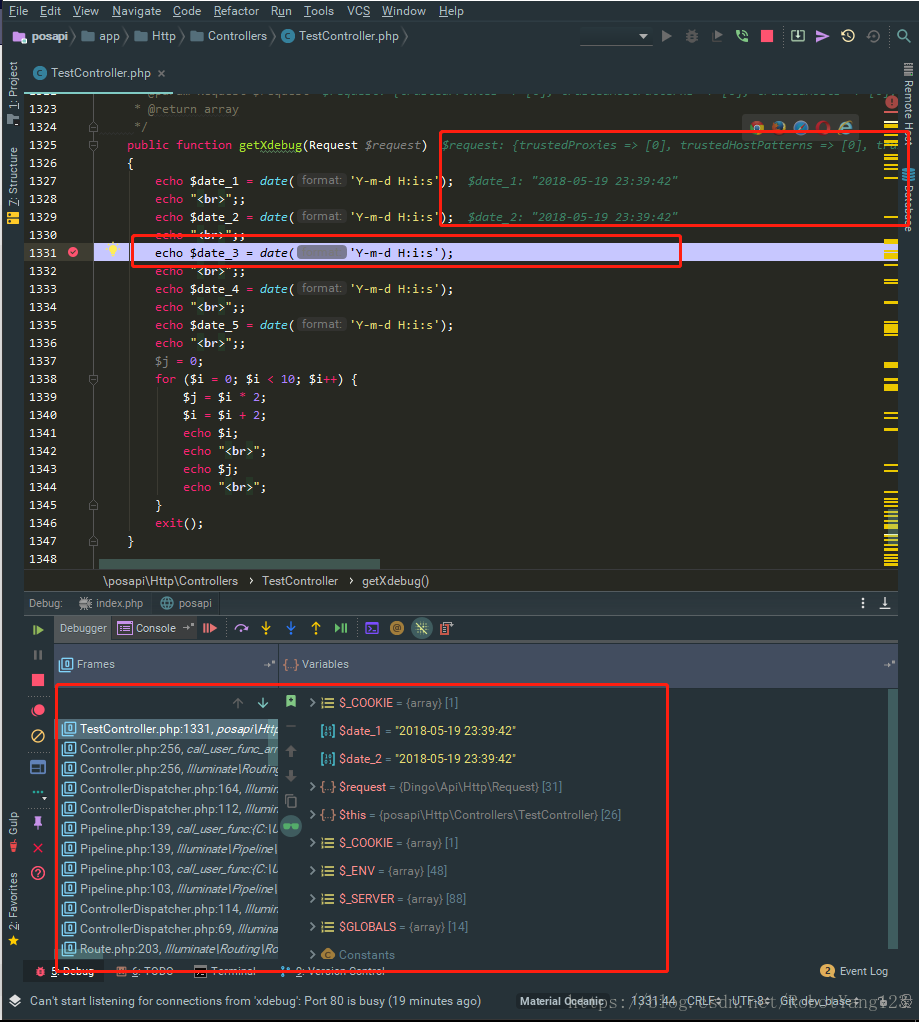
除錯快捷鍵
- F7 通過當前行,進入下一行,如果該行是方法,則進入方法體
- F8 通過當前行,進入下一行,如果該行是方法,也直接進入下一行,不進入方法體
- F9 通過整個流程,全部順序執行
要點總結
PHP安裝Xdebug模組,設定xdebug.remote_enable=1或者OnPostman在 API 域名下的cookie中新增XDEBUG_SESSION=PHPSTORMPhpStorm啟動小電話,開啟偵聽