
AspNet Core下利用 app-metrics+Grafana + InfluxDB實現高大上的效能監控介面
在日常系統工作中,我們為了洞察系統的問題和運作情況通常會記錄日誌的方式來進行分析,但是在很多情況下都是被動的在出問題後才會去查日誌。在很多時候,我們可能更需要相對實時的瞭解整個系統或者某一時段的執行的情況,諸如系統出錯的頻率以及響應時間等等指標。這些動態的準實時資訊對於監控整個系統的執行和健康狀況非常重要,而本文的主角們能通過很好的配合幫助你實現這個目標,而且是一種高大上的實現方式。想想泡杯茶翹著二郎腿看著偌大的螢幕上有著一堆華麗的儀表和曲線圖,即使看不懂也很牛B的樣子啊!(誰知道我看得懂看不懂呢,是不是?)
Q: 那什麼是App-Metrics? A: App Metrics是一個開源和跨平臺的.NET庫,用於記錄應用程式中各項指標。可以在.NET Core上執行,也可以在支援.NET 4.5.2的完整.NET框架上執行。 App Metrics對底層資料來源做了很好的抽象以支援很多型別的資料庫,例如: InfluxDb、Prometheus、ElasticSearch等等。。 同時他又提供了很多Measurements比如Apdex, Gauges, Counters, Meters, Histograms 等等一大堆
1. 安裝Grafana
Q: 什麼是Grafana? A: 一個類似Kibana的視覺化資料開源程式,一般配合時間序列資料庫進行配合來展示資料
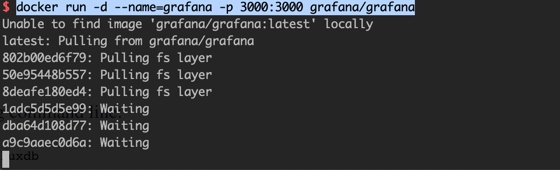
這裡為了方便使用docker來執行Grafana
docker run -d --name=grafana -p 3000:3000 grafana/grafana

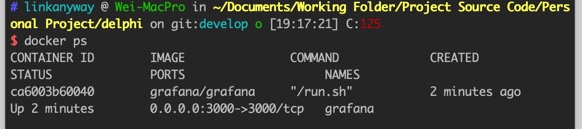
接著我們確認下是否正常運行了
docker ps -a

2. 安裝 InfluxDB
InfluxDb是比較流行的時序資料庫,可以根據需要替換成Prometheus同上為了方便我們還是使用docker來執行 如果你希望每次都能保持之前docker執行收集的資料可以用docker 的-v選項把目錄對映到本機的目錄以便持久化資料
==注意influxdb有2個埠一個是admin一個database==
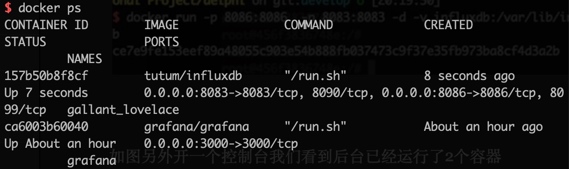
docker run -d -p 8083:8083 -p 8086:8086 --expose 8090 --expose 8099 tutum/influxdb
如圖另外開一個控制檯我們看到後臺已經運行了2個容器

3. 配置AspNet Core2.x
-
先照常新建一個MVC專案
 
 -
安裝所需的第三方庫
dotnet add package App.Metrics.Extensions.Mvc
dotnet add package App.Metrics.Formatters.Json
dotnet add package App.Metrics.Extensions.Reporting.InfluxDB
控制檯顯示安裝成功!
 
 -
修改Startup.cs
using System; using System.Collections.Generic; using System.Linq; using System.Threading.Tasks; using App.Metrics.Configuration; using App.Metrics.Extensions.Reporting.InfluxDB; using App.Metrics.Extensions.Reporting.InfluxDB.Client; using App.Metrics.Reporting.Interfaces; using Microsoft.AspNetCore.Builder; using Microsoft.AspNetCore.Hosting; using Microsoft.AspNetCore.Http; using Microsoft.AspNetCore.HttpsPolicy; using Microsoft.AspNetCore.Mvc; using Microsoft.Extensions.Configuration; using Microsoft.Extensions.DependencyInjection; namespace WebApplication1 { public class Startup { public Startup(IConfiguration configuration) { Configuration = configuration; } public IConfiguration Configuration { get; } public void ConfigureServices(IServiceCollection services) { #region 註冊 App-Metrics & 配置輸出report到influxdb var database = "MyMetrics"; var uri = new Uri(" http://127.0.0.1:8086 "); //本地Docker中執行的influx例項,注意InfluxDb有2個埠別搞錯 services.AddMetrics(options => { options.WithGlobalTags((globalTags, info) => { globalTags.Add("app", info.EntryAssemblyName); globalTags.Add("env", "stage"); }); }) .AddHealthChecks() .AddReporting( factory => { factory.AddInfluxDb( new InfluxDBReporterSettings { InfluxDbSettings = new InfluxDBSettings(database, uri), ReportInterval = TimeSpan.FromSeconds(5) }); }) .AddMetricsMiddleware(options => options.IgnoredHttpStatusCodes = new[] {404}); #endregion services.Configure<CookiePolicyOptions>(options => { options.CheckConsentNeeded = context => true; options.MinimumSameSitePolicy = SameSiteMode.None; }); //新增Metric Filter到mvc services.AddMvc(options => options.AddMetricsResourceFilter()) .SetCompatibilityVersion(CompatibilityVersion.Version_2_1); } // This method gets called by the runtime. Use this method to configure the HTTP request pipeline. public void Configure(IApplicationBuilder app, IHostingEnvironment env, ILoggerFactory loggerFactory, IApplicationLifetime lifetime) { if (env.IsDevelopment()) { app.UseDeveloperExceptionPage(); } else { app.UseExceptionHandler("/Home/Error"); app.UseHsts(); } app.UseHttpsRedirection(); app.UseStaticFiles(); app.UseCookiePolicy(); loggerFactory.AddConsole(Configuration.GetSection(" Logging ")); app.UseMetrics(); app.UseMetricsReporting(lifetime); app.UseMvc(routes => { routes.MapRoute( name: "default", template: "{controller=Home}/{action=Index}/{id?}"); }); } } } -
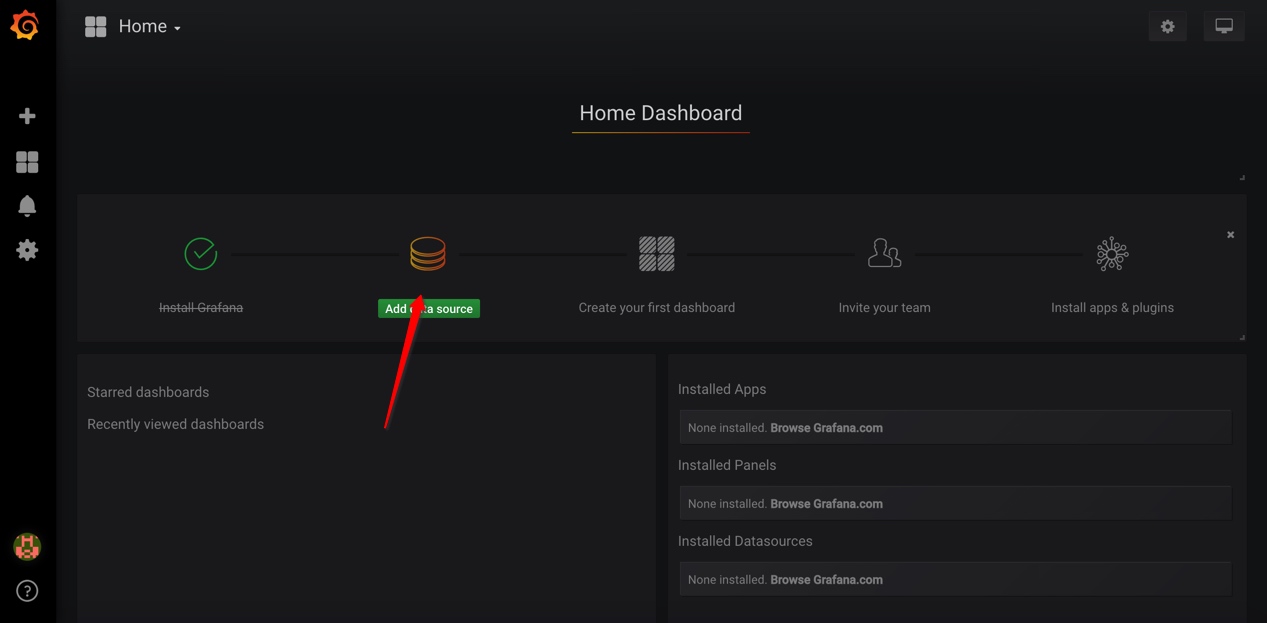
接下來就是配置豪華的Grafana了! 開啟瀏覽器試著訪問docker內執行的Grafana容器,預設的使用者名稱和密碼是admin/admin 不用擔心,第一次登入成功後系統會要求你重新設定新的密碼,很貼心!!
 
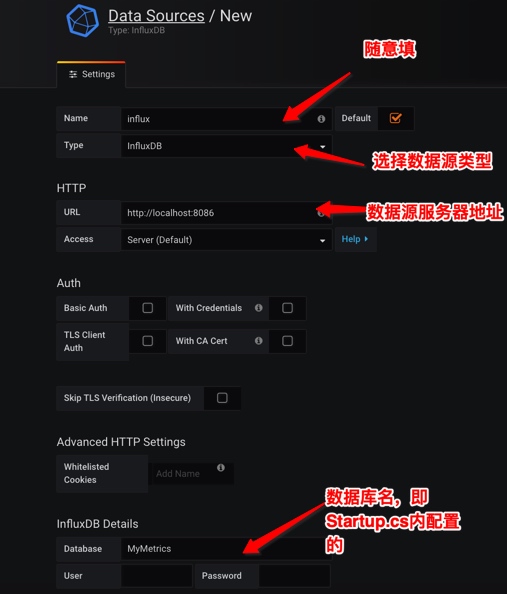
登入成功後,配置Datasource當然是選擇我們之前執行的InfluxDb

按圖進行配置

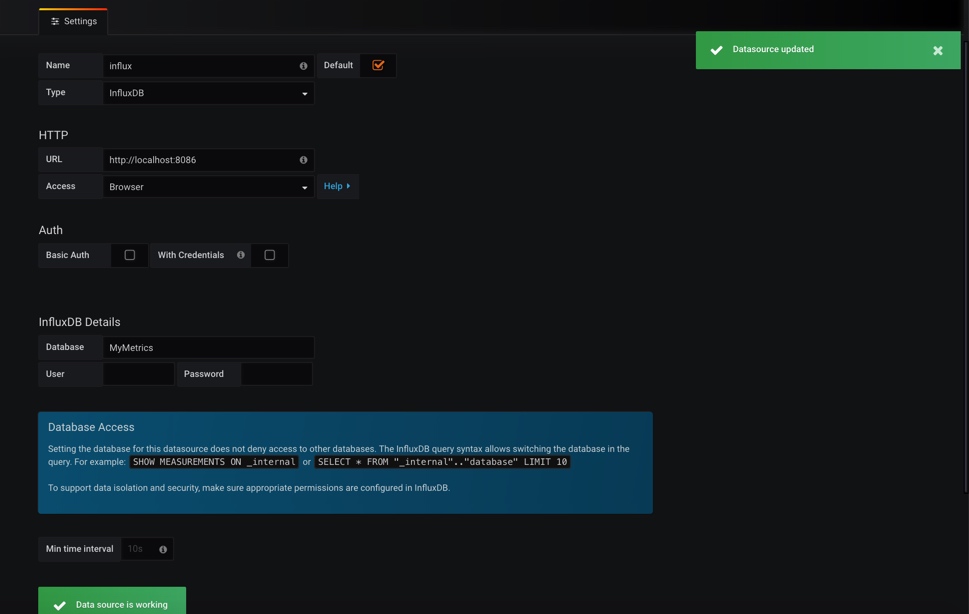
提交後,如下圖顯示即配置成功

接著就是建立你的Dashboard,可以自己建立也可以自己配置json檔案匯入,網上有很多例子可以直接下載
{
"__inputs": [],
"__requires": [
{
"type": "grafana",
"id": "grafana",
"name": "Grafana",
"version": "4.2.0"
},
{
"type": "panel",
"id": "grafana-piechart-panel",
"name": "Pie Chart",
"version": "1.1.4"
},
{
"type": "panel",
"id": "graph",
"name": "Graph",
"version": ""
},
{
"type": "panel",
"id": "singlestat",
"name": "Singlestat",
"version": ""
},
{
"type": "panel",
"id": "table",
"name": "Table",
"version": ""
}
],
"annotations": {
"list": []
},
"description": "Dashboard to visualize metrics captured by App Metrics ASP.NET Core Middleware 1.2.0, tested with App.Metrics.Extensions.Reporting.InfluxDB 1.2.0 - http://app-metrics.io/",
"editable": true,
"gnetId": 2125,
"graphTooltip": 1,
"hideControls": false,
"id": null,
"links": [],
"refresh": "5s",
"rows": [
{
"collapse": true,
"height": "250",
"panels": [
{
"cacheTimeout": null,
"colorBackground": false,
"colorValue": false,
"colors": [
"rgba(245, 54, 54, 0.9)",
"rgba(237, 129, 40, 0.89)",
"rgba(50, 172, 45, 0.97)"
],
"datasource": "$datasource",
"editable": true,
"error": false,
"format": "rpm",
"gauge": {
"maxValue": 100,
"minValue": 0,
"show": false,
"thresholdLabels": false,
"thresholdMarkers": true
},
"id": 8,
"interval": "",
"links": [],
"mappingType": 1,
"mappingTypes": [
{
"name": "value to text",
"value": 1
},
{
"name": "range to text",
"value": 2
}
],
"maxDataPoints": 100,
"nullPointMode": "connected",
"nullText": null,
"postfix": "",
"postfixFontSize": "50%",
"prefix": "",
"prefixFontSize": "50%",
"rangeMaps": [
{
"from": "null",
"text": "N/A",
"to": "null"
}
],
"span": 2,
"sparkline": {
"fillColor": "rgba(31, 118, 189, 0.18)",
"full": true,
"lineColor": "rgb(31, 120, 193)",
"show": true
},
"targets": [
{
"dsType": "influxdb",
"groupBy": [
{
"params": [
"$interval"
],
"type": "time"
},
{
"params": [
"null"
],
"type": "fill"
}
],
"measurement": "application.httprequests__transactions",
"policy": "default",
"refId": "A",
"resultFormat": "time_series",
"select": [
[
{
"params": [
"rate1m"
],
"type": "field"
},
{
"params": [],
"type": "last"
}
]
],
"tags": [
{
"key": "app",
"operator": "=~",
"value": "/^$application$/"
},
{
"condition": "AND",
"key": "env",
"operator": "=~",
"value": "/^$environment$/"
},
{
"condition": "AND",
"key": "server",
"operator": "=~",
"value": "/^$server$/"
}
]
}
],
"thresholds": "",
"title": "Throughput",
"type": "singlestat",
"valueFontSize": "80%",
"valueMaps": [
{
"op": "=",
"text": "N/A",
"value": "null"
}
],
"valueName": "current"
},
{
"cacheTimeout": null,
"colorBackground": false,
"colorValue": false,
"colors": [
"rgba(50, 172, 45, 0.97)",
"rgba(237, 129, 40, 0.89)",
"rgba(245, 54, 54, 0.9)"
],
"datasource": "$datasource",
"decimals": 4,
"editable": true,
"error": false,
"format": "percent",
"gauge": {
"maxValue": 100,
"minValue": 0,
"show": false,
"thresholdLabels": false,
"thresholdMarkers": true
},
"id": 6,
"interval": null,
"links": [],
"mappingType": 1,
"mappingTypes": [
{
"name": "value to text",
"value": 1
},
{
"name": "range to text",
"value": 2
}
],
"maxDataPoints": 100,
"nullPointMode": "connected",
"nullText": null,
"postfix": "",
"postfixFontSize": "50%",
"prefix": "",
"prefixFontSize": "50%",
"rangeMaps": [
{
"from": "",
"text": "",
"to": ""
}
],
"span": 2,
"sparkline": {
"fillColor": "rgba(31, 118, 189, 0.18)",
"full": true,
"lineColor": "rgb(31, 120, 193)",
"show": true
},
"targets": [
{
"dsType": "influxdb",
"groupBy": [],
"measurement": "application.httprequests__one_minute_error_percentage_rate",
"policy": "default",
"query": "SELECT \"value\" FROM \"application.httprequests__percentage_error_requests\" WHERE $timeFilter",
"rawQuery": false,
"refId": "A",
"resultFormat": "time_series",
"select": [
[
{
"params": [
"value"
],
"type": "field"
}
]
],
"tags": [
{
"key": "env",
"operator": "=~",
"value": "/^$environment$/"
},
{
"condition": "AND",
"key": "app",
"operator": "=~",
"value": "/^$application$/"
},
{
"condition": "AND",
"key": "server",
"operator": "=~",
"value": "/^$server$/"
}
]
}
],
"thresholds": "",
"title": "Error %",
"type": "singlestat",
"valueFontSize": "80%",
"valueMaps": [
{
"op": "=",
"text": "0%",
"value": "null"
}
],
"valueName": "current"
},
{
"aliasColors": {},
"bars": false,
"datasource": "$datasource",
"editable": true,
"error": false,
"fill": 2,
"id": 13,
"interval": "$summarize",
"legend": {
"avg": false,
"current": false,
"max": false,
"min": false,
"show": false,
"total": false,
"values": false
},
"lines": true,
"linewidth": 1,
"links": [],
"nullPointMode": "connected",
"percentage": false,
"pointradius": 5,
"points": false,
"renderer": "flot",
"seriesOverrides": [],
"span": 4,
"stack": false,
"steppedLine": false,
"targets": [
{
"alias": "",
"dsType": "influxdb",
"groupBy": [
{
"params": [
"$interval"
],
"type": "time"
},
{
"params": [
"null"
],
"type": "fill"
}
],
"measurement": "application.httprequests__active",
"policy": "default",
"refId": "A",
"resultFormat": "time_series",
"select": [
[
{
"params": [
"value"
],
"type": "field"
},
{
"params": [],
"type": "last"
}
]
],
"tags": [
{
"key": "env",
"operator": "=~",
"value": "/^$environment$/"
},
{
"condition": "AND",
"key": "app",
"operator": "=~",
"value": "/^$application$/"
},
{
"condition": "AND",
"key": "server",
"operator": "=~",
"value": "/^$server$/"
}
]
}
],
"thresholds": [],
"timeFrom": null,
"timeShift": null,
"title": "Active Requests",
"tooltip": {
"msResolution": false,
"shared": true,
"sort": 0,
"value_type": "individual"
},
"type": "graph",
"xaxis": {
"mode": "time",
"name": null,
"show": true,
"values": []
},
"yaxes": [
{
"format": "short",
"label": null,
"logBase": 1,
"max": null,
"min": null,
"show": true
},
{
"format": "short",
"label": null,
"logBase": 1,
"max": null,
"min": null,
"show": true
}
]
},
{
"aliasColors": {
"application.httprequests__apdex.last": "#6ED0E0"
},
"bars": false,
"datasource": "$datasource",
"editable": true,
"error": false,
"fill": 1,
"height": "",
"id": 7,
"interval": "$summarize",
"legend": {
"avg": false,
"current": false,
"max": false,
"min": false,
"show": false,
"total": false,
"values": false
},
"lines": true,
"linewidth": 3,
"links": [],
"nullPointMode": "connected",
"percentage": false,
"pointradius": 5,
"points": false,
"renderer": "flot",
"seriesOverrides": [],
"span": 4,
"stack": false,
"steppedLine": false,
"targets": [
{
"dsType": "influxdb",
"groupBy": [
{
"params": [
"$interval"
],
"type": "time"
},
{
"params": [
"null"
],
"type": "fill"
}
],
"measurement": "application.httprequests__apdex",
"policy": "default",
"refId": "A",
"resultFormat": "time_series",
"select": [
[
{
"params": [
"score"
],
"type": "field"
},
{
"params": [],
"type": "last"
}
]
],
"tags": [
{
"key": "app",
"operator": "=~",
"value": "/^$application$/"
},
{
"condition": "AND",
"key": "env",
"operator": "=~",
"value": "/^$environment$/"
},
{
"condition": "AND",
"key": "server",
"operator": "=~",
"value": "/^$server$/"
}
]
}
],
"thresholds": [
{
"colorMode": "critical",
"fill": true,
"line": true,
"op": "lt",
"value": 0.5
},
{
"colorMode": "warning",
"fill": true,
"line": true,
"op": "gt",
"value": 0.5
},
{
"colorMode": "ok",
"fill": true,
"line": true,
"op": "gt",
"value": 0.75
}
],
"timeFrom": null,
"timeShift": null,
"title": "Apdex score",
"tooltip": {
"msResolution": false,
"shared": true,
"sort": 0,
"value_type": "individual"
},
"type": "graph",
"xaxis": {
"mode": "time",
"name": null,
"show": true,
"values": []
},
"yaxes": [
{
"format": "short",
"label": "apdex",
"logBase": 1,
"max": "1",
"min": "0",
"show": true
},
{
"format": "short",
"label": null,
"logBase": 1,
"max": null,
"min": null,
"show": false
}
]
},
{
"aliasColors": {},
"bars": false,
"datasource": "$datasource",
"editable": true,
"error": false,
"fill": 1,
"height": "350",
"id": 1,
"interval": "$summarize",
"legend": {
"avg": false,
"current": true,
"max": false,
"min": false,
"show": true,
"total": false,
"values": true
},
"lines": true,
"linewidth": 1,
"links": [],
"nullPointMode": "connected",
"percentage": false,
"pointradius": 5,
"points": false,
"renderer": "flot",
"seriesOverrides": [],
"span": 6,
"stack": false,
"steppedLine": false,
"targets": [
{
"alias": "$col",
"dsType": "influxdb",
"groupBy": [
{
"params": [
"$interval"
],
"type": "time"
},
{
"params": [
"null"
],
"type": "fill"
}
],
"measurement": "application.httprequests__transactions",
"policy": "default",
"refId": "A",
"resultFormat": "time_series",
"select": [
[
{
"params": [
"rate1m"
],
"type": "field"
},
{
"params": [],
"type": "last"
},
{
"params": [
"1 min rate"
],
"type": "alias"
}
],
[
{
"params": [
"rate5m"
],
"type": "field"
},
{
"params": [],
"type": "last"
},
{
"params": [
"5 min rate"
],
"type": "alias"
}
],
[
{
"params": [
"rate15m"
],
"type": "field"
},
{
"params": [],
"type": "last"
},
{
"params": [
"15 min rate"
],
"type": "alias"
}
]
],
"tags": [
{
"key": "env",
"operator": "=~",
"value": "/^$environment$/"
},
{
"condition": "AND",
"key": "app",
"operator": "=~",
"value": "/^$application$/"
},
{
"condition": "AND",
"key": "server",
"operator": "=~",
"value": "/^$server$/"
}
]
}
],
"thresholds": [],
"timeFrom": null,
"timeShift": null,
"title": "Throughput",
"tooltip": {
"msResolution": false,
"shared": true,
"sort": 0,
"value_type": "individual"
},
"type": "graph",
"xaxis": {
"mode": "time",
"name": null,
"show": true,
"values": []
},
"yaxes": [
{
"format": "rpm",
"label": null,
"logBase": 1,
"max": null,
"min": null,
"show": true
},
{
"format": "short",
"label": null,
"logBase": 1,
"max": null,
"min": null,
"show": true
}
]
},
{
"aliasColors": {},
"bars": false,
"datasource": "$datasource",
"editable": true,
"error": false,
"fill": 1,
"height": "350",
"id": 2,
"interval": "$summarize",
"legend": {
"alignAsTable": false,
"avg": false,
"current": false,
"max": false,
"min": false,
"rightSide": false,
"show": true,
"total": false,
"values": false
},
"lines": true,
"linewidth": 1,
"links": [],
"nullPointMode": "connected",
"percentage": false,
"pointradius": 5,
"points": false,
"renderer": "flot",
"seriesOverrides": [],
"span": 6,
"stack": false,
"steppedLine": false,
"targets": [
{
"alias": "$col",
"dsType": "influxdb",
"groupBy": [
{
"params": [
"$interval"
],
"type": "time"
},
{
"params": [
"null"
],
"type": "fill"
}
],
"measurement": "application.httprequests__transactions",
"policy": "default",
"refId": "A",
"resultFormat": "time_series",
"select": [
[
{
"params": [
"p95"
],
"type": "field"
},
{
"params": [],
"type": "last"
},
{
"params": [
"95th Percentile"
],
"type": "alias"
}
],
[
{
"params": [
"p98"
],
"type": "field"
},
{
"params": [],
"type": "last"
},
{
"params": [
"98th Percentile"
],
"type": "alias"
}
],
[
{
"params": [
"p99"
],
"type": "field"
},
{
"params": [],
"type": "last"
},
{
"params": [
"99th Percentile"
],
"type": "alias"
}
]
],
"tags": [
{
"key": "env",
"operator": "=~",
"value": "/^$environment$/"
},
{
"condition": "AND",
"key": "app",
"operator": "=~",
"value": "/^$application$/"
},
{
"condition": "AND",
"key": "server",
"operator": "=~",
"value": "/^$server$/"
}
]
}
],
"thresholds": [],
"timeFrom": null,
"timeShift": null,
"title": "Response Time",
"tooltip": {
"msResolution": false,
"shared": true,
"sort": 0,
"value_type": "individual"
},
"type": "graph",
"xaxis": {
"mode": "time",
"name": null,
"show": true,
"values": []
},
"yaxes": [
{
"format": "ms",
"label": null,
"logBase": 1,
"max": null,
"min": null,
"show": true
},
{
"format": "short",
"label": null,
"logBase": 1,
"max": null,
"min": null,
"show": true
}
]
},
{
"aliasColors": {},
"bars": false,
"datasource": "$datasource",
"editable": true,
"error": false,
"fill": 1,
"height": "",
"id": 9,
"interval": "$summarize",
"legend": {
"alignAsTable": true,
"avg": false,
"current": true,
"max": false,
"min": false,
"rightSide": true,
"show": false,
"total": false,
"values": true
},
"lines": true,
"linewidth": 1,
"links": [],
"nullPointMode": "connected",
"percentage": false,
"pointradius": 5,
"points": false,
"renderer": "flot",
"seriesOverrides": [],
"span": 6,
"stack": false,
"steppedLine": false,
"targets": [
{
"alias": "",
"dsType": "influxdb",
"groupBy": [
{
"params": [
"$interval"
],
"type": "time"
},
{
"params": [
"null"
],
"type": "fill"
}
],
"measurement": "application.httprequests__one_minute_error_percentage_rate",
"policy": "default",
"refId": "A",
"resultFormat": "time_series",
"select": [
[
{
"params": [
"value"
],
"type": "field"
},
{
"params": [],
"type": "last"
}
]
],
"tags": [
{
"key": "app",
"operator": "=~",
"value": "/^$application$/"
},
{
"condition": "AND",
"key": "env",
"operator": "=~",
"value": "/^$environment$/"
},
{
"condition": "AND",
"key": "server",
"operator": "=~",
"value": "/^$server$/"
}
]
}
],
"thresholds": [],
"timeFrom": null,
"timeShift": null,
"title": "Error Rate %",
"tooltip": {
"msResolution": false,
"shared": true,
"sort": 0,
"value_type": "individual"
},
"type": "graph",
"xaxis": {
"mode": "time",
"name": null,
"show": true,
"values": []
},
"yaxes": [
{
"format": "percent",
"label": null,
"logBase": 1,
"max": "100",
"min": "0",
"show": true
},
{
"format": "short",
"label": null,
"logBase": 1,
"max": null,
"min": null,
"show": true
}
]
},
{
"aliasColors": {},
"bars": false,
"datasource": "$datasource",
"decimals": 2,
"editable": true,
"error": false,
"fill": 1,
"height": "250px",
"id": 3,
"interval": "$summarize",
"legend": {
"alignAsTable": true,
"avg": false,
"current": true,
"max": false,
"min": false,
"rightSide": true,
"show": true,
"total": false,
"values": true
},
"lines": true,
"linewidth": 1,
"links": [],
"nullPointMode": "connected",
"percentage": false,
"pointradius": 5,
"points": false,
"renderer": "flot",
"seriesOverrides": [],
"span": 6,
"stack": false,
"steppedLine": false,
"targets": [
{
"alias": "$col",
"dsType": "influxdb",
"groupBy": [
{
"params": [
"$interval"
],
"type": "time"
},
{
"params": [
"null"
],
"type": "fill"
}
],
"measurement": "application.httprequests__error_rate",
"policy": "default",
"refId": "A",
"resultFormat": "time_series",
"select": [
[
{
"params": [
"rate1m"
],
"type": "field"
},
{
"params": [],
"type": "last"
},
{
"params": [
"1min rate"
],
"type": "alias"
}
],
[
{
"params": [
"rate5m"
],
"type": "field"
},
{
"params": [],
"type": "last"
},
{
"params": [
"5min rate"
],
"type": "alias"
}
],
[
{
"params": [
"rate15m"
],
"type": "field"
},
{
"params": [],
"type": "last"
},
{
"params": [
"15min rate"
],
"type": "alias"
}
]
],
"tags": [
{
"key": "app",
"operator": "=~",
"value": "/^$application$/"
},
{
"condition": "AND",
"key": "env",
"operator": "=~",
"value": "/^$environment$/"
},
{
"condition": "AND",
"key": "server",
"operator": "=~",
"value": "/^$server$/"
}
]
}
],
"thresholds": [],
"timeFrom": null,
"timeShift": null,
"title": "Error Rate",
"tooltip": {
"msResolution": false,
"shared": true,
"sort": 2,
"value_type": "individual"
},
"type": "graph",
"xaxis": {
"mode": "time",
"name": null,
"show": true,
"values": []
},
"yaxes": [
{
"format": "rpm",
"label": null,
"logBase": 1,
"max": null,
"min": null,
"show": true
},
{
"format": "short",
"label": null,
"logBase": 1,
"max": null,
"min": null,
"show": true
}
]
},
{
"aliasColors": {},
"cacheTimeout": null,
"combine": {
"label": "Others",
"threshold": 0
},
"datasource": "$datasource",
"editable": true,
"error": false,
"fontSize": "80%",
"format": "percent",
"height": "250px",
"id": 4,
"interval": "",
"legend": {
"percentage": true,
"show": true,
"sort": null,
"sortDesc": null,
"values": true
},
"legendType": "Right side",
"links": [],
"maxDataPoints": 3,
"nullPointMode": "connected",
"pieType": "pie",
"span": 5,
"strokeWidth": 1,
"targets": [
{
"alias": "$tag_http_status_code",
"dsType": "influxdb",
"groupBy": [
{
"params": [
"http_status_code"
],
"type": "tag"
}
],
"measurement": "application.httprequests__errors",
"policy": "default",
"refId": "A",
"resultFormat": "time_series",
"select": [
[
{
"params": [
"value"
],
"type": "field"
},
{
"params": [],
"type": "sum"
}
]
],
"tags": [
{
"key": "app",
"operator": "=~",
"value": "/^$application$/"
},
{
"condition": "AND",
"key": "env",
"operator": "=~",
"value": "/^$environment$/"
},
{
"condition": "AND",
"key": "server",
"operator": "=~",
"value": "/^$server$/"
}
]
}
],
"title": "Errors",
"type": "grafana-piechart-panel",
"valueName": "current"
},
{
"columns": [
{
"text": "Total",
"value": "total"
}
],
"datasource": "$datasource",
"editable": true,
"error": false,
"filterNull": true,
"fontSize": "100%",
"id": 24,
"interval": "",
"links": [],
"pageSize": 20,
"scroll": true,
"showHeader": true,
"sort": {
"col": 1,
"desc": true
},
"span": 7,
"styles": [
{
"dateFormat": "YYYY-MM-DD HH:mm:ss",
"pattern": "Time",
"type": "date"
},
{
"colorMode": null,
"colors": [
"rgba(245, 54, 54, 0.9)",
"rgba(237, 129, 40, 0.89)",
"rgba(50, 172, 45, 0.97)"
],
"decimals": 0,
"pattern": "/.*/",
"thresholds": [],
"type": "number",
"unit": "none"
}
],
"targets": [
{
"alias": "$tag_exception",
"dsType": "influxdb",
"groupBy": [
{
"params": [
"$interval"
],
"type": "time"
},
{
"params": [
"exception"
],
"type": "tag"
}
],
"measurement": "application.httprequests__exceptions",
"policy": "default",
"refId": "A",
"resultFormat": "time_series",
"select": [
[
{
"params": [
"value"
],
"type": "field"
},
{
"params": [],
"type": "last"
}
]
],
"tags": [
{
"key": "env",
"operator": "=~",
"value": "/^$environment$/"
},
{
"condition": "AND",
"key": "app",
"operator": "=~",
"value": "/^$application$/"
},
{
"condition": "AND",
"key": "server",
"operator": "=~",
"value": "/^$server$/"
}
]
}
],
"title": "Uncaught Exceptions Thrown",
"transform": "timeseries_aggregations",
"type": "table"
}
],
"repeat": null,
"repeatIteration": null,
"repeatRowId": null,
"showTitle": true,
"title": "Overview",
"titleSize": "h6"
},
{
"collapse": false,
"height": "300",
"panels": [
{
"aliasColors": {},
"bars": false,
"datasource": "$datasource",
"editable": true,
"error": false,
"fill": 1,
"height": "350",
"id": 16,
"interval": "$summarize",
"legend": {
"alignAsTable": true,
"avg": false,
"current": false,
"max": false,
"min": false,
"rightSide": true,
"show": true,
"sort": "current",
"sortDesc": true,
"total": false,
"values": false
},
"lines": true,
"linewidth": 1,
"links": [],
"nullPointMode": "connected",
"percentage": false,
"pointradius": 5,
"points": false,
"renderer": "flot",
"seriesOverrides": [],
"span": 6,
"stack": true,
"steppedLine": false,
"targets": [
{
"alias": "$tag_route",
"dsType": "influxdb",
"groupBy": [
{
"params": [
"$interval"
],
"type": "time"
},
{
"params": [
"route"
],
"type": "tag"
},
{
"params": [
"null"
],
"type": "fill"
}
],
"measurement": "application.httprequests__transactions_per_endpoint",
"policy": "default",
"refId": "A",
"resultFormat": "time_series",
"select": [
[
{
"params": [
"rate1m"
],
"type": "field"
},
{
"params": [],
"type": "last"
}
]
],
"tags": [
{
"key": "env",
"operator": "=~",
"value": "/^$environment$/"
},
{
"condition": "AND",
"key": "app",
"operator": "=~",
"value": "/^$application$/"
},
{
"condition": "AND",
"key": "server",
"operator": "=~",
"value": "/^$server$/"
}
]
}
],
"thresholds": [],
"timeFrom": null,
"timeShift": null,
"title": "Throughput / Endpoint",
"tooltip": {
"msResolution": false,
"shared": true,
"sort": 2,
"value_type": "individual"
},
"transparent": false,
"type": "graph",
"xaxis": {
"mode": "time",
"name": null,
"show": true,
"values": []
},
"yaxes": [
{
"format": "rpm",
"label": null,
"logBase": 1,
"max": null,
"min": null,
"show": true
},
{
"format": "short",
"label": null,
"logBase": 1,
"max": null,
"min": null,
"show": true
}
]
},
{
"aliasColors": {},
"bars": false,
"datasource": "$datasource",
"editable": true,
"error": false,
"fill": 1,
"height": "350",
"id": 17,
"interval": "$summarize",
"legend": {
"alignAsTable": true,
"avg": false,
"current": false,
"max": false,
"min": false,
"rightSide": true,
"show": true,
"total": false,
"values": false
},
"lines": true,
"linewidth": 1,
"links": [],
"nullPointMode": "connected",
"percentage": false,
"pointradius": 5,
"points": false,
"renderer": "flot",
"seriesOverrides": [],
"span": 6,
"stack": false,
"steppedLine": false,
"targets": [
{
"alias": "$tag_route",
"dsType": "influxdb",
"groupBy": [
{
"params": [
"$interval"
],
"type": "time"
},
{
"params": [
"route"
],
"type": "tag"
},
{
"params": [
"null"
],
"type": "fill"
}
],
"measurement": "application.httprequests__transactions_per_endpoint",
"policy": "default",
"refId": "A",
"resultFormat": "time_series",
"select": [
[
{
"params": [
"p95"
],
"type": "field"
},
{
"params": [],
"type": "last"
},
{
"params": [
"95th Percentile"
],
"type": "alias"
}
]
],
"tags": [
{
"key": "env",
"operator": "=~",
"value": "/^$environment$/"
},
{
"condition": "AND",
"key": "app",
"operator": "=~",
"value": "/^$application$/"
},
{
"condition": "AND",
"key": "server",
"operator": "=~",
"value": "/^$server$/"
}
]
}
],
"thresholds": [],
"timeFrom": null,
"timeShift": null,
"title": "Response Time / Endpoint",
"tooltip": {
"msResolution": false,
"shared": true,
"sort": 0,
"value_type": "individual"
},
"type": "graph",
"xaxis": {
"mode": "time",
"name": null,
"show": true,
"values": []
},
"yaxes": [
{
"format": "ms",
"label": null,
"logBase": 1,
"max": null,
"min": null,
"show": true
},
{
"format": "short",
"label": null,
"logBase": 1,
"max": null,
"min": null,
"show": true
}
]
},
{
"columns": [
{
"text": "Current",
"value": "current"
}
],
"datasource": "$datasource",
"editable": true,
"error": false,
"filterNull": false,
"fontSize": "100%",
"id": 10,
"interval": "",
"links": [],
"pageSize": null,
"scroll": true,
"showHeader": true,
"sort": {
"col": 1,
"desc": true
},
"span": 6,
"styles": [
{
"dateFormat": "YYYY-MM-DD HH:mm:ss",
"pattern": "Time",
"type": "date"
},
{
"colorMode": null,
"colors": [
"rgba(245, 54, 54, 0.9)",
"rgba(237, 129, 40, 0.89)",
"rgba(50, 172, 45, 0.97)"
],
"decimals": 2,
"pattern": "/.*/",
"thresholds": [],
"type": "number",
"unit": "ms"
}
],
"targets": [
{
"alias": "$tag_route",
"dsType": "influxdb",
"groupBy": [
{
"params": [
"$interval"
],
"type": "time"
},
{
"params": [
"route"
],
"type": "tag"
},
{
"params": [
"null"
],
"type": "fill"
}
],
"measurement": "application.httprequests__transactions_per_endpoint",
"policy": "default",
"refId": "A",
"resultFormat": "time_series",
"select": [
[
{
"params": [
"p95"
],
"type": "field"
},
{
"params": [],
"type": "last"
}
]
],
"tags": [
{
"key": "env",
"operator": "=~",
"value": "/^$environment$/"
},
{
"condition": "AND",
"key": "app",
"operator": "=~",
"value": "/^$application$/"
},
{
"condition": "AND",
"key": "server",
"operator": "=~",
"value": "/^$server$/"
}
]
}
],
"title": "Response Times / Endpoint",
"transform": "timeseries_aggregations",
"type": "table"
},
{
"columns": [
{
"text": "Current",
"value": "current"
}
],
"datasource": "$datasource",
"editable": true,
"error": false,
"filterNull": false,
"fontSize": "100%",
"id": 12,
"interval": "",
"links": [],
"pageSize": null,
"scroll": true,
"showHeader": true,
"sort": {
"col": 1,
"desc": true
},
"span": 6,
"styles": [
{
"dateFormat": "YYYY-MM-DD HH:mm:ss",
"pattern": "Time",
"type": "date"
},
{
"colorMode": null,
"colors": [
"rgba(245, 54, 54, 0.9)",
"rgba(237, 129, 40, 0.89)",
"rgba(50, 172, 45, 0.97)"
],
"decimals": 2,
"pattern": "/.*/",
"thresholds": [],
"type": "number",
"unit": "rpm"
}
],
"targets": [
{
"alias": "$tag_route",
"dsType": "influxdb",
"groupBy": [
{
"params": [
"$interval"
],
"type": "time"
},
{
"params": [
"route"
],
"type": "tag"
},
{
"params": [
"null"
],
"type": "fill"
}
],
"measurement": "application.httprequests__transactions_per_endpoint",
"policy": "default",
"refId": "A",
"resultFormat": "time_series",
"select": [
[
{
"params": [
"rate1m"
],
"type": "field"
},
{
"params": [],
"type": "last"
}
]
],
"tags": [
{
"key": "env",
"operator": "=~",
"value": "/^$environment$/"
},
{
"condition": "AND",
"key": "app",
"operator": "=~",
"value": "/^$application$/"
},
{
"condition": "AND",
"key": "server",
"operator": "=~",
"value": "/^$server$/"
}
]
}
],
"title": "Throughput / Endpoint",
"transform": "timeseries_aggregations",
"type": "table"
},
{
"columns": [
{
"text": "Current",
"value": "current"
}
],
"datasource": "$datasource",
"editable": true,
"error": false,
"filterNull": false,
"fontSize": "100%",
"id": 11,
"interval": "",
"links": [],
"pageSize": null,
"scroll": true,
"showHeader": true,
"sort": {
"col": null,
"desc": false
},
"span": 6,
"styles": [
{
"dateFormat": "YYYY-MM-DD HH:mm:ss",
"pattern": "Time",
"type": "date"
},
{
"colorMode": null,
"colors": [
"rgba(245, 54, 54, 0.9)",
"rgba(237, 129, 40, 0.89)",
"rgba(50, 172, 45, 0.97)"
],
"decimals": 0,
"pattern": "/.*/",
"thresholds": [],
"type": "number",
"unit": "percent"
}
],
"targets": [
{
"alias": "$tag_route",
"dsType": "influxdb",
"groupBy": [
{
"params": [
"$interval"
],
"type": "time"
},
{
"params": [
"route"
],
"type": "tag"
},
{
"params": [
"null"
],
"type": "fill"
}
],
"measurement": "application.httprequests__one_minute_error_percentage_rate_per_endpoint",
"policy": "default",
"refId": "A",
"resultFormat": "time_series",
"select": [
[
{
"params": [
"value"
],
"type": "field"
},
{
"params": [],
"type": "last"
}
]
],
"tags": [
{
"key": "app",
"operator": "=~",
"value": "/^$application$/"
},
{
"condition": "AND",
"key": "env",
"operator": "=~",
"value": "/^$environment$/"
},
{
"condition": "AND",
"key": "server",
"operator": "=~",
"value": "/^$server$/"
}
]
}
],
"title": "Error Request Percentage / Endpoint",
"transform": "timeseries_aggregations",
"type": "table"
},
{
"columns": [
{
"text": "Total",
"value": "total"
}
],
"datasource": "$datasource",
"editable": true,
"error": false,
"filterNull": false,
"fontSize": "100%",
"id": 25,
"interval": "",
"links": [],
"pageSize": null,
"scroll": true,
"showHeader": true,
"sort": {
"col": 1,
"desc": true
},
"span": 6,
"styles": [
{
"dateFormat": "YYYY-MM-DD HH:mm:ss",
"pattern": "Time",
"type": "date"
},
{
"colorMode": null,
"colors": [
"rgba(245, 54, 54, 0.9)",
"rgba(237, 129, 40, 0.89)",
"rgba(50, 172, 45, 0.97)"
],
"decimals": 0,
"pattern": "/.*/",
"thresholds": [],
"type": "number",
"unit": "none"
}
],
"targets": [
{
"alias": "$tag_route [$tag_exception]",
"dsType": "influxdb",
"groupBy": [
{
"params": [
"$interval"
],
"type": "time"
},
{
"params": [
"route"
],
"type": "tag"
},
{
"params": [
"exception"
],
"type": "tag"
}
],
"measurement": "application.httprequests__exceptions",
"policy": "default",
"refId": "A",
"resultFormat": "time_series",
"select": [
[
{
"params": [
"value"
],
"type": "field"
},
{
"params": [],
"type": "last"
}
]
],
"tags": [
{
"key": "env",
"operator": "=~",
"value": "/^$environment$/"
},
{
"condition": "AND",
"key": "app",
"operator": "=~",
"value": "/^$application$/"
},
{
"condition": "AND",
"key": "server",
"operator": "=~",
"value": "/^$server$/"
}
]
}
],
"title": "Uncaught Exceptions Thrown / Endpoint",
"transform": "timeseries_aggregations",
"type": "table"
}
],
"repeat": null,
"repeatIteration": null,
"repeatRowId": null,
"showTitle": true,
"title": "Endpoints",
"titleSize": "h6"
},
{
"collapse": false,
"height": "250",
"panels": [
{
"columns": [
{
"text": "Current",
"value": "current"
}
],
"datasource": "$datasource",
"editable": true,
"error": false,
"filterNull": false,
"fontSize": "100%",
"hideTimeOverride": true,
"id": 22,
"interval": "",