sklearn之svm-葡萄酒質量預測(8)
阿新 • • 發佈:2018-12-15
class sklearn.svm.SVC(C=1.0, kernel=’rbf’, degree=3, gamma=’auto_deprecated’, coef0=0.0, shrinking=True, probability=False, tol=0.001, cache_size=200, class_weight=None, verbose=False, max_iter=-1, decision_function_shape=’ovr’, random_state=None)
C-Support向量分類。
實現基於libsvm。擬合時間複雜度大於樣本數量的二次型,這使其難以擴充套件到包含10000個以上樣本的資料集。
多類支援是根據一對一方案處理的。
核函式的精確數學公式以及gamma、coef0和degree這些引數是比較重要的
>>> linear_svc = svm.SVC(kernel='linear')
>>> linear_svc.kernel
'linear'
>>> rbf_svc = svm.SVC(kernel='rbf')
>>> rbf_svc.kernel
'rbf'

具有自定義核心的分類器與任何其他分類器的行為相同,除了:
欄位support_vectors_現在為空,只有支援向量的索引儲存在support_中 fit()方法中第一個引數的引用(而不是副本)被儲存以供將來引用。如果這個陣列在fit()和predict()的使用之間發生變化,您將會得到 無法預計的結果。 svm也可以做迴歸:
>>> from sklearn import svm
>>> X = [[0, 0], [2, 2]]
>>> y = [0.5, 2.5]
>>> clf = svm.SVR()
>>> clf.fit(X, y)
SVR(C=1.0, cache_size=200, coef0=0.0, degree=3, epsilon=0.1,
gamma='auto_deprecated', kernel='rbf', max_iter=-1, shrinking=True,
tol=0.001, verbose= print(__doc__)
import numpy as np
from sklearn.svm import SVR
import matplotlib.pyplot as plt
# #############################################################################
# Generate sample data
X = np.sort(5 * np.random.rand(40, 1), axis=0)
y = np.sin(X).ravel()
# #############################################################################
# Add noise to targets
y[::5] += 3 * (0.5 - np.random.rand(8))
# #############################################################################
# Fit regression model
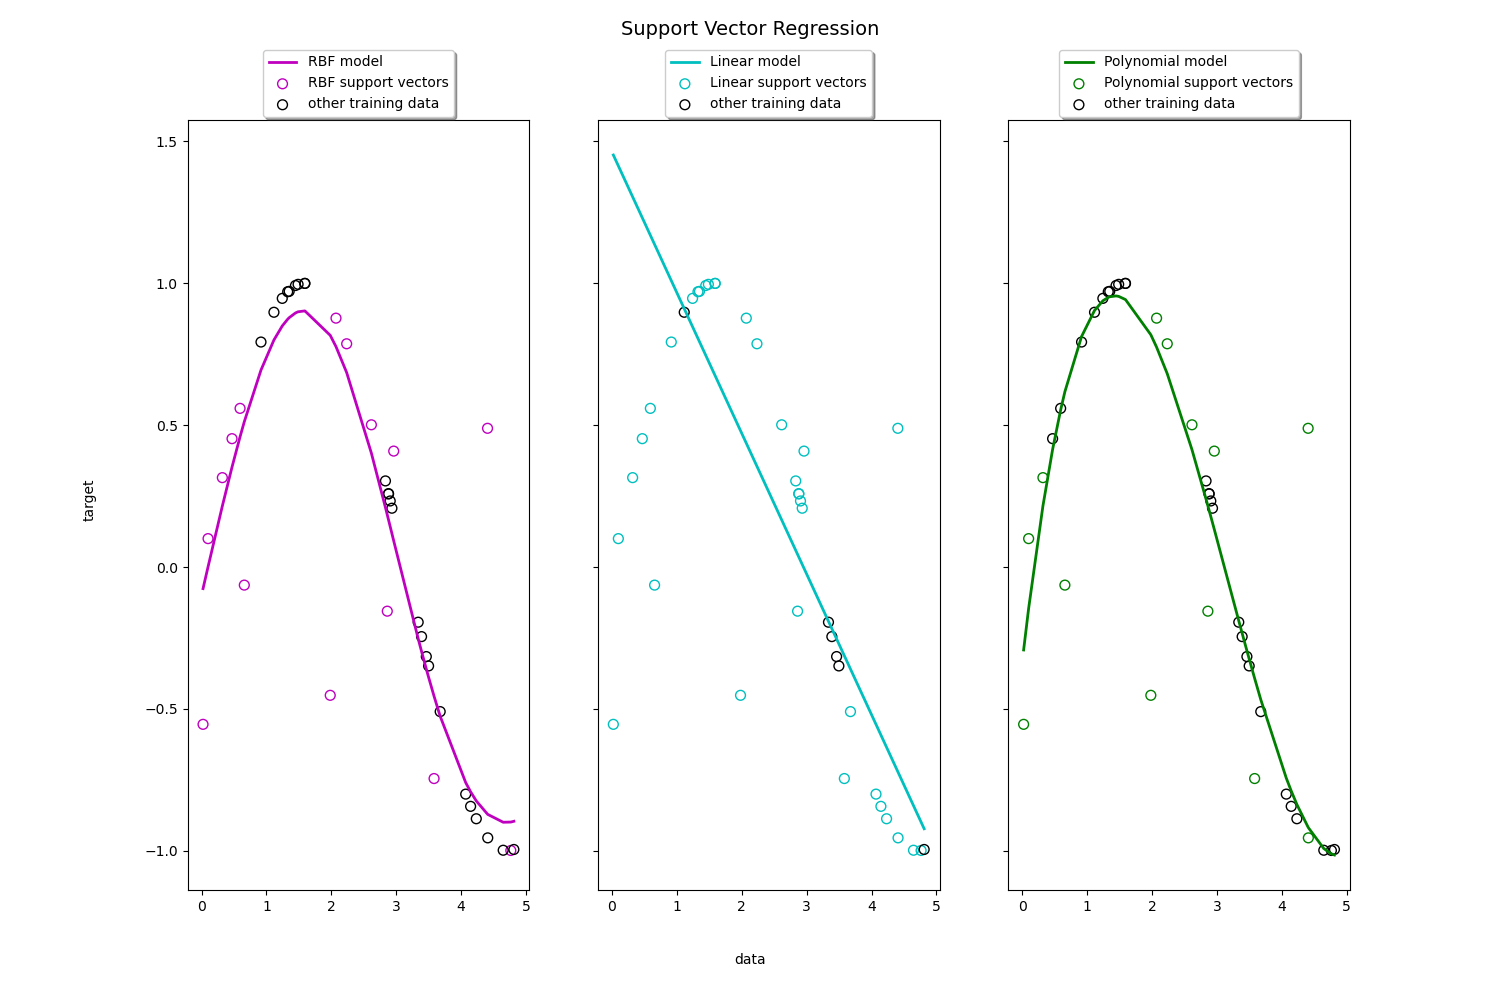
svr_rbf = SVR(kernel='rbf', C=1e3, gamma=0.1)
svr_lin = SVR(kernel='linear', C=1e3)
svr_poly = SVR(kernel='poly', C=1e3, degree=2)
y_rbf = svr_rbf.fit(X, y).predict(X)
y_lin = svr_lin.fit(X, y).predict(X)
y_poly = svr_poly.fit(X, y).predict(X)
# #############################################################################
# Look at the results
lw = 2
plt.scatter(X, y, color='darkorange', label='data')
plt.plot(X, y_rbf, color='navy', lw=lw, label='RBF model')
plt.plot(X, y_lin, color='c', lw=lw, label='Linear model')
plt.plot(X, y_poly, color='cornflowerblue', lw=lw, label='Polynomial model')
plt.xlabel('data')
plt.ylabel('target')
plt.title('Support Vector Regression')
plt.legend()
plt.show()
 我們本例以分類為主,所以不詳細涉及迴歸,以上2個例子是迴歸的簡單例子,核和分類的核一樣。
