【原始碼】MATLAB美圖神器shadedErrorBar:建立連續陰影誤差區域
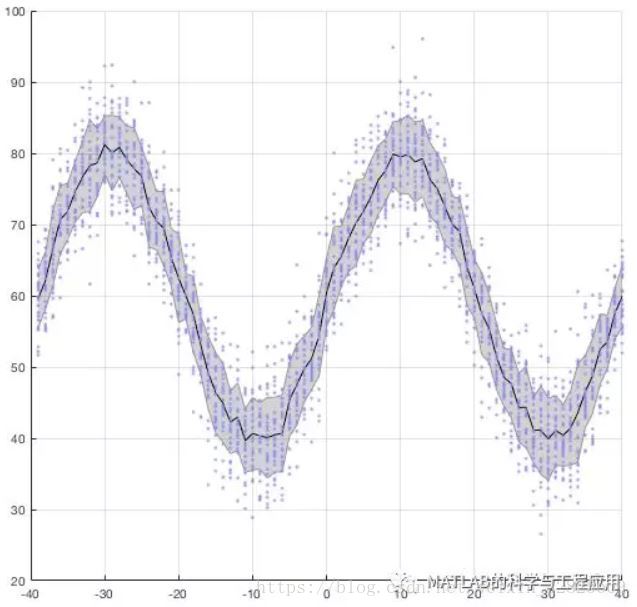
使用舉例1:基本使用方法
% Prepare data y=randn(30,80)5; x=(1:size(y,2))-40; yP = sin( linspace(-2pi,2*pi,length(x)) )*20; y = bsxfun(@plus,y,yP)+60;
% Make the plot clf shadedErrorBar(x,y,{@mean,@std});
% Overlay the raw data hold on plot(x,y,’.’,‘color’,[0.5,0.5,0.95])
grid on
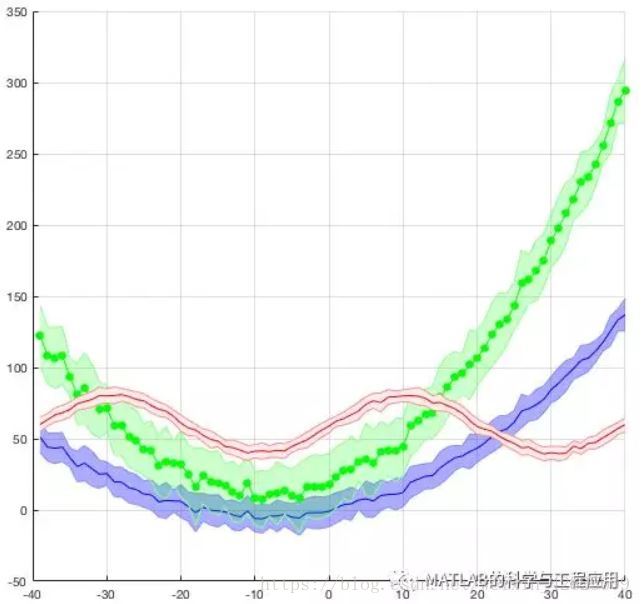
使用舉例2:多條重疊線段繪圖
% Prepare data for first line y=ones(30,1)x; y=y+0.06
clf shadedErrorBar(x,y,{@mean,@std},‘lineprops’,’-b’,‘patchSaturation’,0.33)
% Overlay second line hold on shadedErrorBar(x,2*y+20,{@mean,@std},‘lineprops’,{’-go’,‘MarkerFaceColor’,‘g’});
%Overlay third line y=randn(30,80)5; x=(1:size(y,2))-40; yP = sin( linspace(-2pi,2*pi,length(x)) )*20; y = bsxfun(@plus,y,yP)+60;
% Make this line non-transparent shadedErrorBar(x, y, {@mean,@std}, ‘lineprops’, ‘-r’,‘transparent’,false,‘patchSaturation’,0.075)
grid on
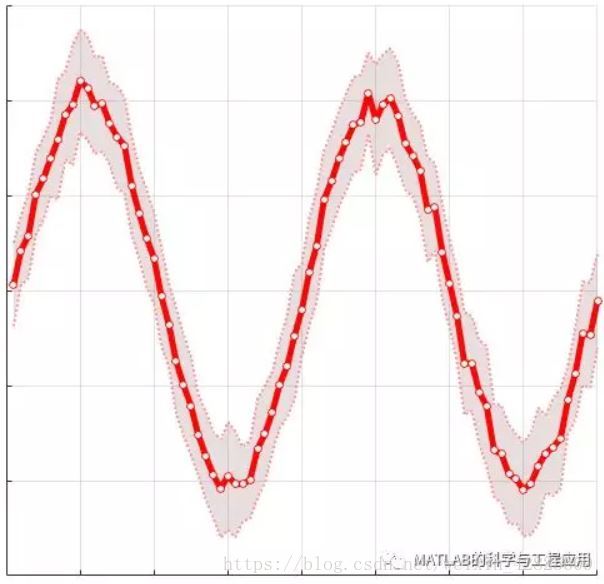
使用舉例3:改變plot函式繪圖特性
% Prepare data y=randn(30,80)5; x=(1:size(y,2)); yP = sin( linspace(-2pi,2*pi,length(x)) )*20; y = bsxfun(@plus,y,yP);
% Plot clf s = shadedErrorBar(x, y, {@mean,@std}, ‘lineprops’, ‘-r’);
% Set face and edge properties set(s.edge,‘LineWidth’,2,‘LineStyle’,’:’) s.mainLine.LineWidth = 5; s.patch.FaceColor = [0.5,0.25,0.25];
% Overlay data points post-hoc hold on plot(s.mainLine.XData, s.mainLine.YData,‘or’,‘MarkerFaceColor’,‘w’)
grid on
set(gca,‘XTickLabel’,[],‘YTickLabel’,[])
MATLAB原始碼下載地址:
更多精彩文章請關注微訊號: