Angular Chart.js第三方庫ng-chartjs基礎使用
阿新 • • 發佈:2018-12-17
Angular Chart.js第三方庫ng-chartjs基礎使用
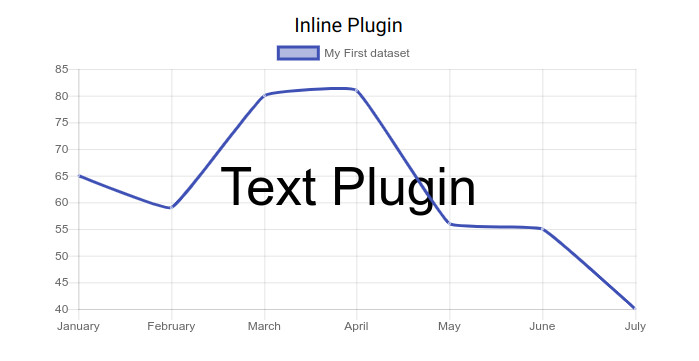
這個專案支援基本的Chart.js圖表,並且支援內聯外掛和全域性外掛的使用。
支援圖表型別
- line
- bar
- radar
- pie
- polarArea
安裝
npm install ng-chartjs --save
npm install chart.js --save
匯入
- 正常匯入模組
import { NgChartjsModule } from 'ng-chartjs';

// In your App's module:
imports: [
   NgChartjsModule
]
- 匯入全域性外掛
import { NgChartjsModule } from 'ng-chartjs';

// In your App's module:
imports: [
   NgChartjsModule.registerPlugin([...])
]
圖表使用
使用ngChartjs指令即可,chartType、labels、datasets或data,必須輸入。
html file.
<canvas ngChartjs [datasets]="lineChartData" [labels]="lineChartLabels"
          [options]="lineChartOptions" [legend]="lineChartLegend" [chartType]="lineChartType"
          [inlinePlugins]="inlinePlugin">
</canvas>
ts file.
...
lineChartData: Array<any> = [
    {
      label: 'My First dataset',
      fill: false,
      lineTension: 0.1,
      backgroundColor: 'rgba(75,192,192,0.4)',
      borderColor: 'rgba(75,192,192,1)',
      borderCapStyle: 'butt',
      borderDash: [],
      borderDashOffset: 0.0,
      borderJoinStyle: 'miter',
      pointBorderColor: 'rgba(75,192,192,1)',
      pointBackgroundColor: '#fff',
      pointBorderWidth: 1,
      pointHoverRadius: 5,
      pointHoverBackgroundColor: 'rgba(75,192,192,1)',
      pointHoverBorderColor: 'rgba(220,220,220,1)',
      pointHoverBorderWidth: 2,
      pointRadius: 1,
      pointHitRadius: 10,
      data: [65, 59, 80, 81, 56, 55, 40],
    },
  ];
  lineChartLabels: Array<any> = ['January', 'February', 'March', 'April', 'May', 'June', 'July'];
  lineChartOptions: any = {
    responsive: true
  };
   lineChartLegend = true;
  lineChartType = 'line';
  inlinePlugin: any;
  textPlugin: any;

  ngOnInit() {
    // inline plugin
    this.textPlugin = [{
      id: 'textPlugin',
      beforeDraw(chart: any): any {
        const width = chart.chart.width;
        const height = chart.chart.height;
        const ctx = chart.chart.ctx;
        ctx.restore();
        const fontSize = (height / 114).toFixed(2);
        ctx.font = `${fontSize}em sans-serif`;
        ctx.textBaseline = 'middle';
        const text = 'Text Plugin';
        const textX = Math.round((width - ctx.measureText(text).width) / 2);
        const textY = height / 2;
        ctx.fillText(text, textX, textY);
        ctx.save();
      }
    }];

    this.inlinePlugin = this.textPlugin;
  }
  ...
View

屬性

事件
- chartClick : fires when click on a chart has occurred, returns information regarding active points and labels
- chartHover : fires when mousemove (hover) on a chart has occurred, returns information regarding active points and labels
