
pandas系列學習(六):資料聚合
作者:chen_h 微訊號 & QQ:862251340 微信公眾號:coderpai
我最近一直在探索的一個方面是通過不同變數對大型資料幀進行分組,以及對每個組應用匯總函式的任務。這是在 pandas 中使用 DataFrame 物件的 groupby() 和 agg() 函式完成。
示例 DataFrame
為了演示分組命令的有效性和簡單性,我們需要一些資料。對於示例資料集,我已經提取了自己的手機使用記錄。如果你也想分析這個資料集,你可以點選這裡進行下載。
該資料集包含來自我的手機日誌的 830 個條目,總時間為 5 個月。可以使用 DataFrame.read_csv() 函式將 CSV 檔案載入到 DataFrame 中,如下所示:
df = pd.read_csv('./phone_data.csv')
df.head()
| index | date | duration | item | month | network | network_type | |
|---|---|---|---|---|---|---|---|
| 0 | 0 | 15/10/14 06:58 | 34.429 | data | 2014-11 | data | data |
| 1 | 1 | 15/10/14 06:58 | 13.000 | call | 2014-11 | Vodafone | mobile |
| 2 | 2 | 15/10/14 14:46 | 23.000 | call | 2014-11 | Meteor | mobile |
| 3 | 3 | 15/10/14 14:48 | 4.000 | call | 2014-11 | Tesco | mobile |
| 4 | 4 | 15/10/14 17:27 | 4.000 | call | 2014-11 | Tesco | mobile |
該檔案的主要列是:
- date:輸入的日期和時間;
- duration:每個呼叫的持續時間(以秒為單位),每個資料條目的資料量(以 MB 為單位),以及每個 sms 條目傳送的文字數(通常為 1);
- item:事件發生的描述——可以是呼叫,簡訊或者資料之一;
- month:每個條目所屬的結算月份——形式為 “YYYY-MM”;
- network:為每個條目呼叫 / 傳送的行動網路;
- network_type:被呼叫的號碼是移動,國際,語音郵件,固定電話還是其他特殊號碼;
刪除了所有的隱私電話,我們可以非常方便的用 dateutil 庫來解析日期列。
import dateutil
data['date'] = data['date'].apply(dateutil.parser.parse, dayfirst=True)
| index | date | duration | item | month | network | network_type | |
|---|---|---|---|---|---|---|---|
| 0 | 0 | 2014-10-15 06:58:00 | 34.429 | data | 2014-11 | data | data |
| 1 | 1 | 2014-10-15 06:58:00 | 13.000 | call | 2014-11 | Vodafone | mobile |
| 2 | 2 | 2014-10-15 14:46:00 | 23.000 | call | 2014-11 | Meteor | mobile |
| 3 | 3 | 2014-10-15 14:48:00 | 4.000 | call | 2014-11 | Tesco | mobile |
| 4 | 4 | 2014-10-15 17:27:00 | 4.000 | call | 2014-11 | Tesco | mobile |
聚合 DataFrame
一旦將資料載入到 Python 中,pandas 就可以非常簡單的計算不同的統計資料。例如,計算列的平均值,最大值,最小值,標準偏差等等。
# How many rows the dataset
print(data['item'].count())

# What was the longest phone call / data entry?
print(data['duration'].max())

# How many seconds of phone calls are recorded in total?
print(data['duration'][data['item'] == 'call'].sum())

# How many entries are there for each month?
print(data['month'].value_counts())

# Number of non-null unique network entries
print(data['network'].nunique())
830
10528.0
92321.0
2014-11    230
2015-01    205
2014-12    157
2015-02    137
2015-03    101
Name: month, dtype: int64
9
除非你有非常具體的要求,否則對自定義功能的需求很小。pandas 中內建的函式已經能基本滿足需求了,具體的函式可以點選這個頁面。
| Function | Description |
|---|---|
count |
Number of non-null observations |
sum |
Sum of values |
mean |
Mean of values |
mad |
Mean absolute deviation |
median |
Arithmetic median of values |
min |
Minimum |
max |
Maximum |
mode |
Mode |
abs |
Absolute Value |
prod |
Product of values |
std |
Unbiased standard deviation |
var |
Unbiased variance |
sem |
Unbiased standard error of the mean |
skew |
Unbiased skewness (3rd moment) |
kurt |
Unbiased kurtosis (4th moment) |
quantile |
Sample quantile (value at %) |
cumsum |
Cumulative sum |
cumprod |
Cumulative product |
cummax |
Cumulative maximum |
cummin |
Cumulative minimum |
.describe() 函式是一個有用的彙總工具,可以快速顯示應用它的任何變數或者組的統計資訊。describe() 輸出取決於你是將其應用於數字列還是字元列。
聚合 DataFrame 中的組
通過掌握 pandas groupby() 函式,你可以獲得更多的快捷。groupby() 實際上根據你選擇的變數將資料拆分為不同的組。例如,表示式 data.groupby(‘month’) 將按月拆分當前的 DataFrame 。
groupby() 函式將返回 GroupBy 物件,但實際上描述瞭如何拆分原始資料集的行。GroupBy 物件.groups變數是一個字典,其鍵是計算的唯一組,對應的值是屬於每個組的軸標籤。例如:
data.groupby(['month']).groups.keys()
dict_keys(['2014-11', '2014-12', '2015-01', '2015-02', '2015-03'])
len(data.groupby(['month']).groups['2014-11'])
230
max(),min(),mean(),first(),last() 等函式可以快速應用於 GroupBy 物件,以獲取每個組的彙總統計資訊 —— 這是一個非常有用的函式。此功能類似於 R 的 dplyr 和 plyr 庫。可以從每個摘要中檢視不同的變數。
# Get the first entry for each month

data.groupby('month').first()
| index | date | duration | item | network | network_type | |
|---|---|---|---|---|---|---|
| month | ||||||
| 2014-11 | 0 | 2014-10-15 06:58:00 | 34.429 | data | data | data |
| 2014-12 | 228 | 2014-11-13 06:58:00 | 34.429 | data | data | data |
| 2015-01 | 381 | 2014-12-13 06:58:00 | 34.429 | data | data | data |
| 2015-02 | 577 | 2015-01-13 06:58:00 | 34.429 | data | data | data |
| 2015-03 | 729 | 2015-02-12 20:15:00 | 69.000 | call | landline | landline |
# Get the sum of the durations per month

data.groupby('month')['duration'].sum()
month
2014-11    26639.441
2014-12    14641.870
2015-01    18223.299
2015-02    15522.299
2015-03    22750.441
Name: duration, dtype: float64
# Get the number of dates / entries in each month

data.groupby('month')['date'].count()
month
2014-11    230
2014-12    157
2015-01    205
2015-02    137
2015-03    101
Name: date, dtype: int64
# What is the sum of durations, for calls only, to each network

data[data['item'] == 'call'].groupby('network')['duration'].sum()
network
Meteor        7200.0
Tesco        13828.0
Three        36464.0
Vodafone     14621.0
landline     18433.0
voicemail     1775.0
Name: duration, dtype: float64
你還可以按多個變數進行分組,從而允許更復雜的查詢。
# How many calls, sms, and data entries are in each month?

data.groupby(['month', 'item'])['date'].count()
month    item
2014-11  call    107
         data     29
         sms      94
2014-12  call     79
         data     30
         sms      48
2015-01  call     88
         data     31
         sms      86
2015-02  call     67
         data     31
         sms      39
2015-03  call     47
         data     29
         sms      25
Name: date, dtype: int64
# How many calls, texts, and data are sent per month, split by network_type?

data.groupby(['month', 'network_type'])['date'].count()
month    network_type
2014-11  data             29
         landline          5
         mobile          189
         special           1
         voicemail         6
2014-12  data             30
         landline          7
         mobile          108
         voicemail         8
         world             4
2015-01  data             31
         landline         11
         mobile          160
         voicemail         3
2015-02  data             31
         landline          8
         mobile           90
         special           2
         voicemail         6
2015-03  data             29
         landline         11
         mobile           54
         voicemail         4
         world             3
Name: date, dtype: int64
Groupby 輸出格式 —— Series 或者 DataFrame?
groupby 和聚合操作的輸出在 padnas Series 和 pandas DataFrame 之間變化,這可能會讓新使用者感到困惑。根據經驗,如果計算多個結果列,則結果將為 DataFrame 。對於單列結果,預設情況下,agg 函式將生成一個 Series。
你可以通過不同的選擇操作列來更改此設定:
data.groupby('month')['duration'].sum() # produces Pandas Series
month
2014-11    26639.441
2014-12    14641.870
2015-01    18223.299
2015-02    15522.299
2015-03    22750.441
Name: duration, dtype: float64
data.groupby('month')[['duration']].sum() # Produces Pandas DataFrame
| duration | |
|---|---|
| month | |
| 2014-11 | 26639.441 |
| 2014-12 | 14641.870 |
| 2015-01 | 18223.299 |
| 2015-02 | 15522.299 |
| 2015-03 | 22750.441 |
Groupby 輸出將在與你選擇的分組變數對應的行上具有索引或者多索引。要避免設定此索引,請將 as_index=False 傳遞給 groupby 操作。
data.groupby('month', as_index=False).agg({"duration": "sum"})
| month | duration | |
|---|---|---|
| 0 | 2014-11 | 26639.441 |
| 1 | 2014-12 | 14641.870 |
| 2 | 2015-01 | 18223.299 |
| 3 | 2015-02 | 15522.299 |
| 4 | 2015-03 | 22750.441 |
在 pandas 中對資料進行分組時使用 as_index 引數可防止在結果中設定行索引。
每組多個統計資訊
我們將要檢查的最後一段語法是 pandas 的 agg() 函式。agg() 函式提供的聚合功能允許在一次計算中按組計算多個統計資料。語法很簡單,類似於 MongoDB 的聚合框架。
2017 年 5 月對 pandas 聚合函式進行了重大更改。在 agg() 函式中重新命名變數不再如下圖所示 —— 請參考註釋。
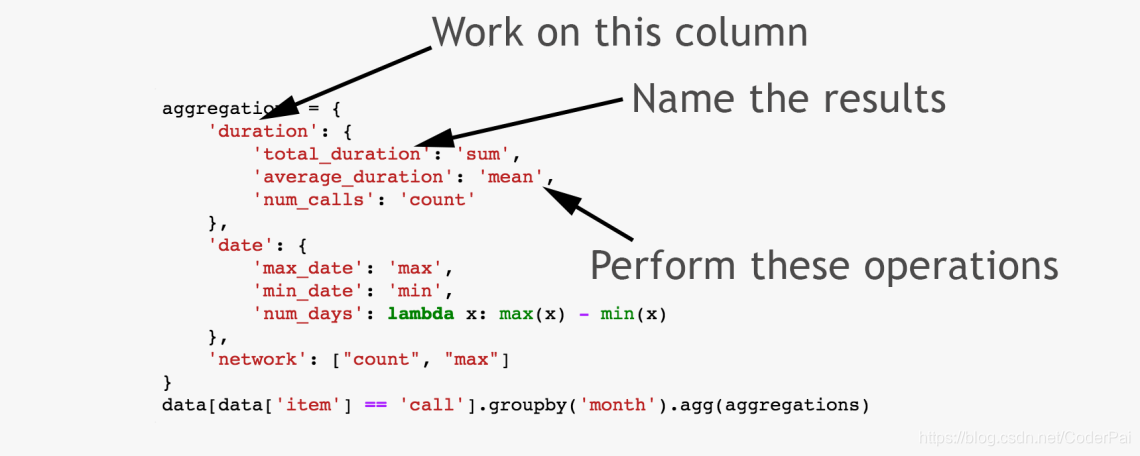
使用 agg() 函式聚合 pandas DataFrame 中的變數。請注意,在 pandas 版本 0.20.1 以後,結果的重新命名需要單獨完成。
將單個函式應用於組中的列
聚合指令以 Python 字典或列表的形式提供。字典鍵用於指定要執行操作的列,以及用於制定要執行的函式的字典值。例如:
# Group the data frame by month and item and extract a number of stats from each group
data.groupby(['month', 'item']).agg({'duration':sum,      # find the sum of the durations for each group
                                     'network_type': "count", # find the number of network type entries
                                     'date': 'first'})    # get the first date per group
| duration | network_type | date | ||
|---|---|---|---|---|
| month | item | |||
| 2014-11 | call | 25547.000 | 107 | 2014-10-15 06:58:00 |
| data | 998.441 | 29 | 2014-10-15 06:58:00 | |
| sms | 94.000 | 94 | 2014-10-16 22:18:00 | |
| 2014-12 | call | 13561.000 | 79 | 2014-11-14 17:24:00 |
| data | 1032.870 | 30 | 2014-11-13 06:58:00 | |
| sms | 48.000 | 48 | 2014-11-14 17:28:00 | |
| 2015-01 | call | 17070.000 | 88 | 2014-12-15 20:03:00 |
| data | 1067.299 | 31 | 2014-12-13 06:58:00 | |
| sms | 86.000 | 86 | 2014-12-15 19:56:00 | |
| 2015-02 | call | 14416.000 | 67 | 2015-01-15 10:36:00 |
| data | 1067.299 | 31 | 2015-01-13 06:58:00 | |
| sms | 39.000 | 39 | 2015-01-15 12:23:00 | |
| 2015-03 | call | 21727.000 | 47 | 2015-02-12 20:15:00 |
| data | 998.441 | 29 | 2015-02-13 06:58:00 | |
| sms | 25.000 | 25 | 2015-02-19 18:46:00 |
聚合字典語法是靈活的,可以在操作之前定義。你還可以使用 lambda 函式內聯定義函式,以提取內建選項未提供的統計資訊。
# Define the aggregation procedure outside of the groupby operation
aggregations = {
    'duration':'sum',
    'date': lambda x: max(x) - 1
}
data.groupby('month').agg(aggregations)
將多個函式應用於組中的列
要將多個函式應用於分組資料中的單個列,請展開上面的語法,將函式列表作為聚合資料框中的值傳遞。如下:
# Group the data frame by month and item and extract a number of stats from each group
data.groupby(['month', 'item']).agg({'duration': [min, max, sum],      # find the min, max, and sum of the duration column
                                     'network_type': "count", # find the number of network type entries
                                     'date': [min, 'first', 'nunique']})    # get the min, first, and number of unique dates per group
| duration | network_type | date | ||||||
|---|---|---|---|---|---|---|---|---|
| min | max | sum | count | min | first | nunique | ||
| month | item | |||||||
| 2014-11 | call | 1.000 | 1940.000 | 25547.000 | 107 | 2014-10-15 06:58:00 | 2014-10-15 06:58:00 | 104 |
| data | 34.429 | 34.429 | 998.441 | 29 | 2014-10-15 06:58:00 | 2014-10-15 06:58:00 | 29 | |
| sms | 1.000 | 1.000 | 94.000 | 94 | 2014-10-16 22:18:00 | 2014-10-16 22:18:00 | 79 | |
| 2014-12 | call | 2.000 | 2120.000 | 13561.000 | 79 | 2014-11-14 17:24:00 | 2014-11-14 17:24:00 | 76 |
| data | 34.429 | 34.429 | 1032.870 | 30 | 2014-11-13 06:58:00 | 2014-11-13 06:58:00 | 30 | |
| sms | 1.000 | 1.000 | 48.000 | 48 | 2014-11-14 17:28:00 | 2014-11-14 17:28:00 | 41 | |
| 2015-01 | call | 2.000 | 1859.000 | 17070.000 | 88 | 2014-12-15 20:03:00 | 2014-12-15 20:03:00 | 84 |
| data | 34.429 | 34.429 | 1067.299 | 31 | 2014-12-13 06:58:00 | 2014-12-13 06:58:00 | 31 | |
| sms | 1.000 | 1.000 | 86.000 | 86 | 2014-12-15 19:56:00 | 2014-12-15 19:56:00 | 58 | |
| 2015-02 | call | 1.000 | 1863.000 | 14416.000 | 67 | 2015-01-15 10:36:00 | 2015-01-15 10:36:00 | 67 |
| data | 34.429 | 34.429 | 1067.299 | 31 | 2015-01-13 06:58:00 | 2015-01-13 06:58:00 | 31 | |
| sms | 1.000 | 1.000 | 39.000 | 39 | 2015-01-15 12:23:00 | 2015-01-15 12:23:00 | 27 | |
| 2015-03 | call | 2.000 | 10528.000 | 21727.000 | 47 | 2015-02-12 20:15:00 | 2015-02-12 20:15:00 | 47 |
| data | 34.429 | 34.429 | 998.441 | 29 | 2015-02-13 06:58:00 | 2015-02-13 06:58:00 | 29 | |
| sms | 1.000 | 1.000 | 25.000 | 25 | 2015-02-19 18:46:00 | 2015-02-19 18:46:00 | 17 |
agg(…) 語法靈活且易於使用。請記住,你可以將自定義和 lambda 函式傳遞到聚合計算列表,並且每個函式都將從分組資料中的列傳遞值。
從 groupby 操作重新命名分組統計資訊
在列上計算多個統計資訊時,結果資料框將在列軸中設定多個索引。這可能很難處理,我同行必須在 groupby 操作後重命名列。
一種選擇是使用以下方法刪除新建立的多索引的 top level:
grouped = data.groupby('month').agg("duration": [min, max, mean])
grouped.columns = grouped.columns.droplevel(level=0)
grouped.rename(columns={"min": "min_duration", "max": "max_duration", "mean": "mean_duration"})
grouped.head()