Python3資料分析入門實戰_04 玩轉Pandas 中
-
Apply進行資料預處理
案例 Demo# 資料讀入 df = pd.read_csv('J:/csv/apply_demo.csv') # 採用Series為DataFrame新增新列 'A' s1 = Series(['a'] * 7978) df['A'] = s1 ----------------------------------------- time data A 0 1473411962 Symbol: APPL Seqno: 0 Price: 1623 a 1 1473411962 Symbol: APPL Seqno: 0 Price: 1623 a 2 1473411963 Symbol: APPL Seqno: 0 Price: 1623 a 3 1473411963 Symbol: APPL Seqno: 0 Price: 1623 a 4 1473411963 Symbol: APPL Seqno: 1 Price: 1649 a =================================================================
上述資料框中列data照片那個資料需要進行預處理
  # data 中資料 需要做列拆分
  # strip() 去除首尾空格
  # split() 分隔資料項
  df['data'][0].strip().split(' ')
  ----------------------------------
  ['Symbol:', 'APPL', 'Seqno:', '0', 'Price:', '1623']
自定義函式進行處理:實現上述程式碼功能,並返回data.dict中的values(通過索引)
  # 自定義函式進行處理
  def foo(data):
        items = data.strip().split(' ')
        return Series([items[1], items[3], items[5]])
apply 進行資料預處理
  # 臨時df 儲存分隔後的 date列
  df_temp = df['data'].apply(foo)
  -------------------------------
        0	1	2
  0	APPL	0	1623
  1	APPL	0	1623
  2	APPL	0	1623
  3	APPL	0	1623
  4	APPL	1	1649
臨時DataFrame列重新命名
  # 列重新命名
  df_new = df_temp.rename(columns={
        0: 'Symbol',
        1: 'Seqno',
        2: 'Price'
  })
  ---------------------------------
      Symbol	Seqno	Price
  0	    APPL	0	    1623
  1	    APPL	0	    1623
  2	    APPL	0	    1623
  3	    APPL	0	    1623
  4	    APPL	1	    1649
臨時DataFrame與原DataFrame合併
  # 將分隔完成的列新增到原df上
  df_ = df.combine_first(df_new)
  # 去除不必要的列 'A' 和列 'data'
  del df_['A']
  del df_['data']
  ------------------------------
  	Price	Seqno	Symbol	time
  0	1623.0	0.0	    APPL	1473411962
  1	1623.0	0.0	    APPL	1473411962
  2	1623.0	0.0	    APPL	1473411963
  3	1623.0	0.0	    APPL	1473411963
  4	1649.0	1.0	    APPL	1473411963
儲存至CSV檔案
  # 儲存至檔案
  df_.to_csv('demo_duplicate.csv', index=False)
-
資料去重 參照預處理得到的
demo_duplicate.csv資料檔案
如果儲存CSV的時候,未新增index=False,再次讀出的資料會出現索引列(列名為:Unnamed: 0),建議儲存時進行索引去除。Price Seqno Symbol time 0 1623.0 0.0 APPL 1473411962 1 1623.0 0.0 APPL 1473411962 2 1623.0 0.0 APPL 1473411963 3 1623.0 0.0 APPL 1473411963 4 1649.0 1.0 APPL 1473411963
通過上述資料展示可以看出:time為基準(索引0、1,索引2、3重複),Seqno為基準(索引0、1、2、3重複),Symbol為基準(索引0、1、2、3、4重複),Price為基準(索引0、1、2、3重複)
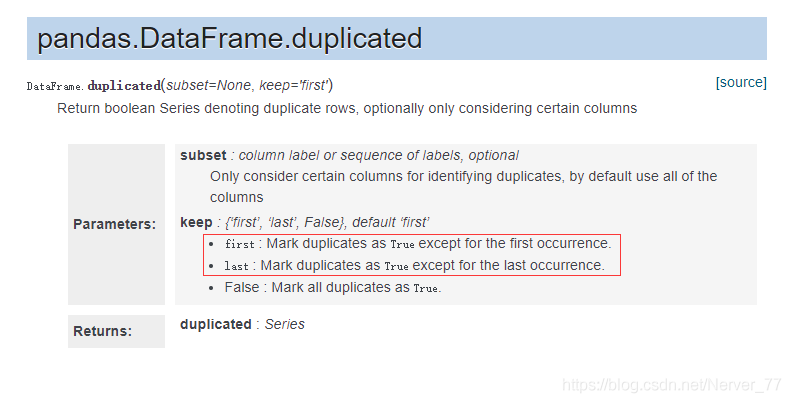
重複檢查方法:duplicated()

  # 針對Seqno列進行去重,可通過keep引數選擇保留首次出現的資料項或最終出現的資料項
  # 去重前先檢視下該列的重複情況 duplicated函式進行檢視
  df['Seqno'].duplicated()
  ------------------------
  0       False
  1        True
  2        True
  3        True
  4       False
去重方法:drop_duplicates()
  # 使用 drop_duplicates() 進行列去重
  df.drop_duplicates(['Seqno'])
  ----------------------------------
        Price	Seqno	Symbol	time
  0	    1623.0	0.0	    APPL	1473411962
  4	    1649.0	1.0	    APPL	1473411963
-
時間序列的操作基礎
引入datetimefrom datetime import datetime t1 = datetime(2018, 12, 7) ----------------------------- datetime.datetime(2018, 12, 7, 0, 0)建立時間序列
# 時間列表
date_list = {
      datetime(2016,6,6),
      datetime(2016,7,7),
      datetime(2018,8,18),
      datetime(2015,5,15),
      datetime(2014,4,14),
}
# 時間序列
s1 = Series(np.random.randn(5), index=date_list)
------------------------------------------------
2018-08-18   -0.400025
2016-06-06    0.053413
2014-04-14    1.068531
2015-05-15    0.382434
2016-07-07    0.036097
dtype: float64
特殊訪問方式:模糊匹配
s1['2016-']
-----------
2016-06-06    0.053413
2016-07-07    0.036097
dtype: float64
生成特定時間內的時間序列
# 從2018-01-01 開始,長度為5,步長限制為W(周) 預設從SUN-SAT date_list = pd.date_range('2018-01-01', periods=5, freq='W') ------------------------------------------------------------ 2018-01-07 -1.601305 2018-01-14 0.554921 2018-01-21 0.344534 2018-01-28 0.040423 2018-02-04 -0.707336 Freq: W-SUN, dtype: float64 -
時間序列資料的取樣和畫圖
-
取樣
# 模擬時間列表 時間維度為一年
t_range = pd.date_range('2016-01-01', '2016-12-31')
# 構建時間序列
s1 = Series(np.random.randn(len(t_range)), index = t_range)
用
datetime作為序列索引可通過模糊匹配進行更好的資料取樣工作。# 將一個月的資料平均值作為一個數據點,生成長度為12的資料集合 s1['2016-01'].mean() # 按照索引(月份)進行資料取樣(平均值資料) s1_month = s1.resample('M').mean() ---------------------------------- 2016-01-31 -0.018625 2016-02-29 0.231429 2016-03-31 0.256555 2016-04-30 0.200803 2016-05-31 0.229022 2016-06-30 0.115717 2016-07-31 -0.207785 2016-08-31 -0.002188 2016-09-30 0.076884 2016-10-31 0.233269 2016-11-30 -0.303828 2016-12-31 -0.028217 Freq: M, dtype: float64備註:
# 也可以按照小時取樣,但是資料項需要填充 ffill()、bfill() s1.resample('H').bfill() -
畫圖:結合上述例子,將時間序列按照月份取樣後進行畫圖
# 準備時間序列
t = pd.date_range('2018-01-01', '2018-12-31')
# 構建DataFrame
df = DataFrame(index = t)
# 填充資料列
df['S1'] = np.random.randint(0, 15, size = 365)
df['S2'] = np.random.randint(0, 30, size = 365)
# 引入matplotlib
import matplotlib.pyplot as plt
# 畫圖
df.plot()
此時,畫出的圖比較密集,不適合檢視,接下來進行資料取樣重新構圖。
# 準備一個新的DataFrame
df_ = DataFrame()
# 對時間序列的資料按照月份進行平均值取樣
df_['S1'] = df['S1'].resample('M').mean()
df_['S2'] = df['S2'].resample('M').mean()
-
-
資料分箱技術Binning:
cut()
分數統計Demo,資料準備# 原資料集 score_list = np.random.randint(25, 100, size=20) # 區間設定 bins = [0, 59, 70, 80, 100]資料分箱
# 資料分箱
res = pd.cut(score_list, bins)
# res 的資料型別
CategoricalDtype(categories=[(0, 59], (59, 70], (70, 80], (80, 100]]
                  ordered=True)
# cut 方法是將score_list 中的數值按照分箱區間 bins 劃分到不同的組中
# 相當將每一個數據項都打上分箱標籤
pd.value_counts(res)
--------------------
(80, 100]    7
(0, 59]      7
(59, 70]     5
(70, 80]     1
dtype: int64
例子拓展
# 容器建立
df = DataFrame()
# 資料項填充
df['score'] = score_list
df['name'] = [pd.util.testing.rands(3) for i in range(20)]
# 資料分箱
df['res'] = pd.cut(df['score'], bins, labels = ['Low', 'OK', 'Good', 'Great'])
這裡需要注意:labels 和 bins 中的分箱標籤要保持對應統一
df.sort_values('score', ascending = False).head() ------------------------------------------------- score name res 1 90 dlw Great 7 90 HyF Great 17 87 a4M Great 11 82 L2y Great 19 73 lF5 Good -
資料分組技術GroupBy:
groupby()# 資料分組 g = df.groupby('city') # 檢視組內資料項集合 g.groups -------- {'BJ': Int64Index([0, 1, 2, 3, 4, 5], dtype='int64'), 'GZ': Int64Index([14, 15, 16, 17], dtype='int64'), 'SH': Int64Index([6, 7, 8, 9, 10, 11, 12, 13], dtype='int64'), 'SZ': Int64Index([18, 19], dtype='int64')} =========================================== # 檢視某個資料項集合 g.get_group('BJ') # 對組內資料項進行apply g.get_group('BJ').mean() ------------------------ temperature 10.000000 wind 2.833333 dtype: float64 ======================== # 對全組進行apply、 g.max() ------------------------------------------- date temperature wind city BJ 31/01/2016 19 5 GZ 31/07/2016 25 5 SH 27/03/2016 20 5 SZ 25/09/2016 20 4 =========================================== g_ = df.groupby(['city', 'wind']) # 獲取具體資料項集合的時候需要採用元組的形式作為獲取引數 g_.get_group(('BJ',2)) ---------------------- date city temperature wind 1 17/01/2016 BJ 12 2 2 31/01/2016 BJ 19 2 4 28/02/2016 BJ 19 2
Groupby = Split + Apply + Combine

-
資料聚合技術Aggregation:
agg()還是上述例子,對分組後資料的處理apply,我們採用
agg()方法代替。# agg() 進行資料聚合,含有內建函式 g.agg('mean') ------------- temperature wind city BJ 10.000 2.833333 GZ 8.750 4.000000 SH 4.625 3.625000 SZ 5.000 2.500000 ======================== # 自定義聚合函式 def foo(data): return data.max() - data.min() g.agg(foo) ---------- temperature wind city BJ 22 3 GZ 26 3 SH 30 3 SZ 30 3 -
透視表:
pivot_table()
透視表類比檢視作用,要對資料表結構比較熟悉和了解。# 讀入資料檔案 df = pd.read_excel('J:/csv/sales-funnel.xlsx') # aggfunc預設為mean求平均 # Manager 對應多個 Rep # aggfunc 變更為求和 sum 計算出 price、quantity的和 # columns 針對具體列資料項進行處理 ### 以下就是根據表結構構建的透視表,Manager-Rep的對應關係,以及每個Rep在每個產品上[銷售業績、銷售數量] pd.pivot_table(df, index=['Manager', 'Rep'], values=['Price', 'Quantity'], columns = ['Product'], aggfunc=['sum'], fill_value=0)

