
ECharts 柱狀圖 -- 會隨著值的大小變化的漸變色
阿新 • • 發佈:2018-12-23
Echarts 柱狀圖
效果圖:
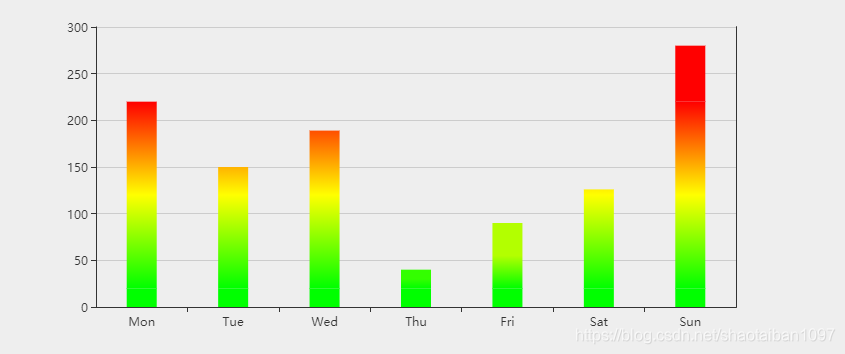
0 ~ 20: 綠色
20 ~ 200: 綠色 — 黃色 — 紅色
200 ~ : 紅色
var myCharts = echarts.init(document.getElementById("view"));
/* 基礎資料 */
var base = [220, 150, 189, 40, 90, 126, 280];
var warningValue = 20; //警告值
var errorValue = 220; //錯誤值
var normal = []; //正常範圍 0~20
var warning = []; //警告範圍 20~200
var error =