
prometheus 監控之 elasticsearch5.x
阿新 • • 發佈:2018-12-25
安裝監控外掛
專案地址:https://github.com/justwatchcom/elasticsearch_exporter
外掛下載地址:https://github.com/justwatchcom/elasticsearch_exporter/releases/download/v1.0.4rc1/elasticsearch_exporter-1.0.4rc1.linux-amd64.tar.gz
簡單介紹下安裝:
[[email protected] ~]$ tar zxvf elasticsearch_exporter-1.0.4rc1.linux-amd64.tar.gz [[email protected] ~]$ cd elasticsearch_exporter [[email protected] ~]$ cp elasticsearch_exporter /usr/local/bin [[email protected] ~]$ /usr/local/bin/elasticsearch_exporter --web.listen-address "0.0.0.0:9109" --es.uri http://elastic:[email protected]:9201 [[email protected] ~]$ curl localhost:9109/metrics
配置prometheus
- job_name: 'elasticsearch'
  file_sd_configs:
  - refresh_interval: 1m
    files:
    - ./conf.d/es*.json
配置consul自動發現請參考:我的另一篇部落格
指標解析
參考:
https://grafana.com/dashboards/2322
https://yq.aliyun.com/articles/548354
https://blog.csdn.net/u013613428/article/details/78179430
| 指標 | 解析 |
|---|---|
| ##搜尋和索引效能 | |
| elasticsearch_indices_search_query_total | 查詢總數 吞吐量 |
| elasticsearch_indices_search_query_time_seconds | 查詢總時間 效能 |
| elasticsearch_indices_search_fetch_total | 提取總數 |
| elasticsearch_indices_search_fetch_time_seconds | 花費在提取上的總時間 |
| ##索引請求 | |
| elasticsearch_indices_indexing_index_total | 索引的檔案總數 |
| elasticsearch_indices_indexing_index_time_seconds_total | 索引文件總時間 |
| elasticsearch_indices_indexing_delete_total | 索引的檔案刪除總數 |
| elasticsearch_indices_indexing_delete_time_seconds_total | 索引的檔案刪除總時間 |
| elasticsearch_indices_refresh_total | 索引重新整理總數 |
| elasticsearch_indices_refresh_time_seconds_total | 重新整理指數的總時間 |
| elasticsearch_indices_flush_total | 索引重新整理總數到磁碟 |
| elasticsearch_indices_flush_time_seconds | 將索引重新整理到磁碟上的總時間 累計flush時間 |
| ##JVM記憶體和垃圾回收 | |
| elasticsearch_jvm_gc_collection_seconds_sum | GC run time in seconds垃圾回收時間 |
| elasticsearch_jvm_gc_collection_seconds_count | Count of JVM GC runs垃圾蒐集數 |
| elasticsearch_jvm_memory_committed_bytes | JVM memory currently committed by area最大使用記憶體限制 |
| elasticsearch_jvm_memory_max_bytes | 配置的最大jvm值 |
| elasticsearch_jvm_memory_pool_max_bytes | JVM記憶體最大池數 |
| elasticsearch_jvm_memory_pool_peak_max_bytes | 最大的JVM記憶體峰值 |
| elasticsearch_jvm_memory_pool_peak_used_bytes | 池使用的JVM記憶體峰值 |
| elasticsearch_jvm_memory_pool_used_bytes | 目前使用的JVM記憶體池 |
| elasticsearch_jvm_memory_used_bytes | JVM memory currently used by area 記憶體使用量 |
| ##叢集健康和節點可用性 | |
| elasticsearch_cluster_health_status | 叢集狀態,green( 所有的主分片和副本分片都正常執行)、yellow(所有的主分片都正常執行,但不是所有的副本分片都正常執行)red(有主分片沒能正常執行)值為1的即為對應狀態 |
| elasticsearch_cluster_health_number_of_data_nodes | node節點的數量 |
| elasticsearch_cluster_health_number_of_in_flight_fetch | 正在進行的碎片資訊請求的數量 |
| elasticsearch_cluster_health_number_of_nodes | 叢集內所有的節點 |
| elasticsearch_cluster_health_number_of_pending_tasks | 尚未執行的叢集級別更改 |
| elasticsearch_cluster_health_initializing_shards | 正在初始化的分片數 |
| elasticsearch_cluster_health_unassigned_shards | 未分配分片數 |
| elasticsearch_cluster_health_active_primary_shards | 活躍的主分片總數 |
| elasticsearch_cluster_health_active_shards | 活躍的分片總數(包括複製分片) |
| elasticsearch_cluster_health_relocating_shards | 當前節點正在遷移到其他節點的分片數量,通常為0,叢集中有節點新加入或者退出時該值會增加 |
| ##資源飽和度 | |
| elasticsearch_thread_pool_completed_count | 執行緒池操作完成(bulk、index、search、force_merge) |
| elasticsearch_thread_pool_active_count | 執行緒池執行緒活動(bulk、index、search、force_merge) |
| elasticsearch_thread_pool_largest_count | 執行緒池最大執行緒數(bulk、index、search、force_merge) |
| elasticsearch_thread_pool_queue_count | 執行緒池中的排隊執行緒數(bulk、index、search、force_merge) |
| elasticsearch_thread_pool_rejected_count | 執行緒池的被拒絕執行緒數(bulk、index、search、force_merge) |
| elasticsearch_indices_fielddata_memory_size_bytes | fielddata快取的大小(位元組) |
| elasticsearch_indices_fielddata_evictions | 來自fielddata快取的驅逐次數 |
| elasticsearch_indices_filter_cache_evictions | 來自過濾器快取的驅逐次數(僅版本2.x) |
| elasticsearch_indices_filter_cache_memory_size_bytes | 過濾器快取記憶體的大小(位元組)(僅版本2.x) |
| elasticsearch_cluster_health_number_of_pending_tasks | 待處理任務數 |
| elasticsearch_indices_get_time_seconds | |
| elasticsearch_indices_get_missing_total | 丟失的檔案的GET請求總數 |
| elasticsearch_indices_get_missing_time_seconds | 花費在文件丟失的GET請求上的總時間 |
| elasticsearch_indices_get_exists_time_seconds | |
| elasticsearch_indices_get_exists_total | |
| elasticsearch_indices_get_total | |
| #主機級別的系統和網路指標 | |
| elasticsearch_process_cpu_percent | Percent CPU used by process CPU使用率 |
| elasticsearch_filesystem_data_free_bytes | Free space on block device in bytes 磁碟可用空間 |
| elasticsearch_process_open_files_count | Open file descriptors ES程序開啟的檔案描述符 |
| elasticsearch_transport_rx_packets_total | Count of packets receivedES節點之間網路入流量 |
| elasticsearch_transport_tx_packets_total | Count of packets sentES節點之間網路出流量 |
預警rules
groups:
- name: elasticsearchStatsAlert
  rules:
  - alert: Elastic_Cluster_Health_RED
    expr: elasticsearch_cluster_health_status{color="red"}==1
    for: 1m
    labels:
      severity: critical
    annotations:
      summary: "Instance {{ $labels.instance }}: not all primary and replica shards are allocated in elasticsearch cluster {{ $labels.cluster }}"
      description: "Instance {{ $labels.instance }}: not all primary and replica shards are allocated in elasticsearch cluster {{ $labels.cluster }}."
  - alert: Elastic_Cluster_Health_Yellow
    expr: elasticsearch_cluster_health_status{color="yellow"}==1
    for: 1m
    labels:
      severity: critical
    annotations:
      summary: " Instance {{ $labels.instance }}: not all primary and replica shards are allocated in elasticsearch cluster {{ $labels.cluster }}"
      description: "Instance {{ $labels.instance }}: not all primary and replica shards are allocated in elasticsearch cluster {{ $labels.cluster }}."
  - alert: Elasticsearch_JVM_Heap_Too_High
    expr: elasticsearch_jvm_memory_used_bytes{area="heap"} / elasticsearch_jvm_memory_max_bytes{area="heap"} > 0.8
    for: 1m
    labels:
      severity: critical
    annotations:
      summary: "ElasticSearch node {{ $labels.instance }} heap usage is high "
      description: "The heap in {{ $labels.instance }} is over 80% for 15m."
  - alert: Elasticsearch_health_up
    expr: elasticsearch_cluster_health_up !=1
    for: 1m
    labels:
      severity: critical
    annotations:
      summary: " ElasticSearch node: {{ $labels.instance }} last scrape of the ElasticSearch cluster health failed"
      description: "ElasticSearch node: {{ $labels.instance }} last scrape of the ElasticSearch cluster health failed"
  - alert: Elasticsearch_Too_Few_Nodes_Running
    expr: elasticsearch_cluster_health_number_of_nodes < 12
    for: 1m
    labels:
      severity: critical
    annotations:
      summary: "There are only {{$value}} < 12 ElasticSearch nodes running "
      description: "lasticSearch running on less than 12 nodes(total 14)"
  - alert: Elasticsearch_Count_of_JVM_GC_Runs
    expr: rate(elasticsearch_jvm_gc_collection_seconds_count{}[5m])>5
    for: 1m
    labels:
      severity: critical
    annotations:
      summary: "ElasticSearch node {{ $labels.instance }}: Count of JVM GC runs > 5 per sec and has a value of {{ $value }} "
      description: "ElasticSearch node {{ $labels.instance }}: Count of JVM GC runs > 5 per sec and has a value of {{ $value }}"
  - alert: Elasticsearch_GC_Run_Time
    expr: rate(elasticsearch_jvm_gc_collection_seconds_sum[5m])>0.3
    for: 1m
    labels:
      severity: critical
    annotations:
      summary: " ElasticSearch node {{ $labels.instance }}: GC run time in seconds > 0.3 sec and has a value of {{ $value }}"
      description: "ElasticSearch node {{ $labels.instance }}: GC run time in seconds > 0.3 sec and has a value of {{ $value }}"
  - alert: Elasticsearch_json_parse_failures
    expr: elasticsearch_cluster_health_json_parse_failures>0
    for: 1m
    labels:
      severity: critical
    annotations:
      summary: " ElasticSearch node {{ $labels.instance }}: json parse failures > 0 and has a value of {{ $value }}"
      description: "ElasticSearch node {{ $labels.instance }}: json parse failures > 0 and has a value of {{ $value }}"
  - alert: Elasticsearch_breakers_tripped
    expr: rate(elasticsearch_breakers_tripped{}[5m])>0
    for: 1m
    labels:
      severity: critical
    annotations:
      summary: " ElasticSearch node {{ $labels.instance }}: breakers tripped > 0 and has a value of {{ $value }}"
      description: "ElasticSearch node {{ $labels.instance }}: breakers tripped > 0 and has a value of {{ $value }}"
  - alert: Elasticsearch_health_timed_out
    expr: elasticsearch_cluster_health_timed_out>0
    for: 1m
    labels:
      severity: critical
    annotations:
      summary: " ElasticSearch node {{ $labels.instance }}: Number of cluster health checks timed out > 0 and has a value of {{ $value }}"
      description: "ElasticSearch node {{ $labels.instance }}: Number of cluster health checks timed out > 0 and has a value of {{ $value }}"
prometheus 配置:
rule_files:
  - /usr/local/prometheus/rules/es*.rules
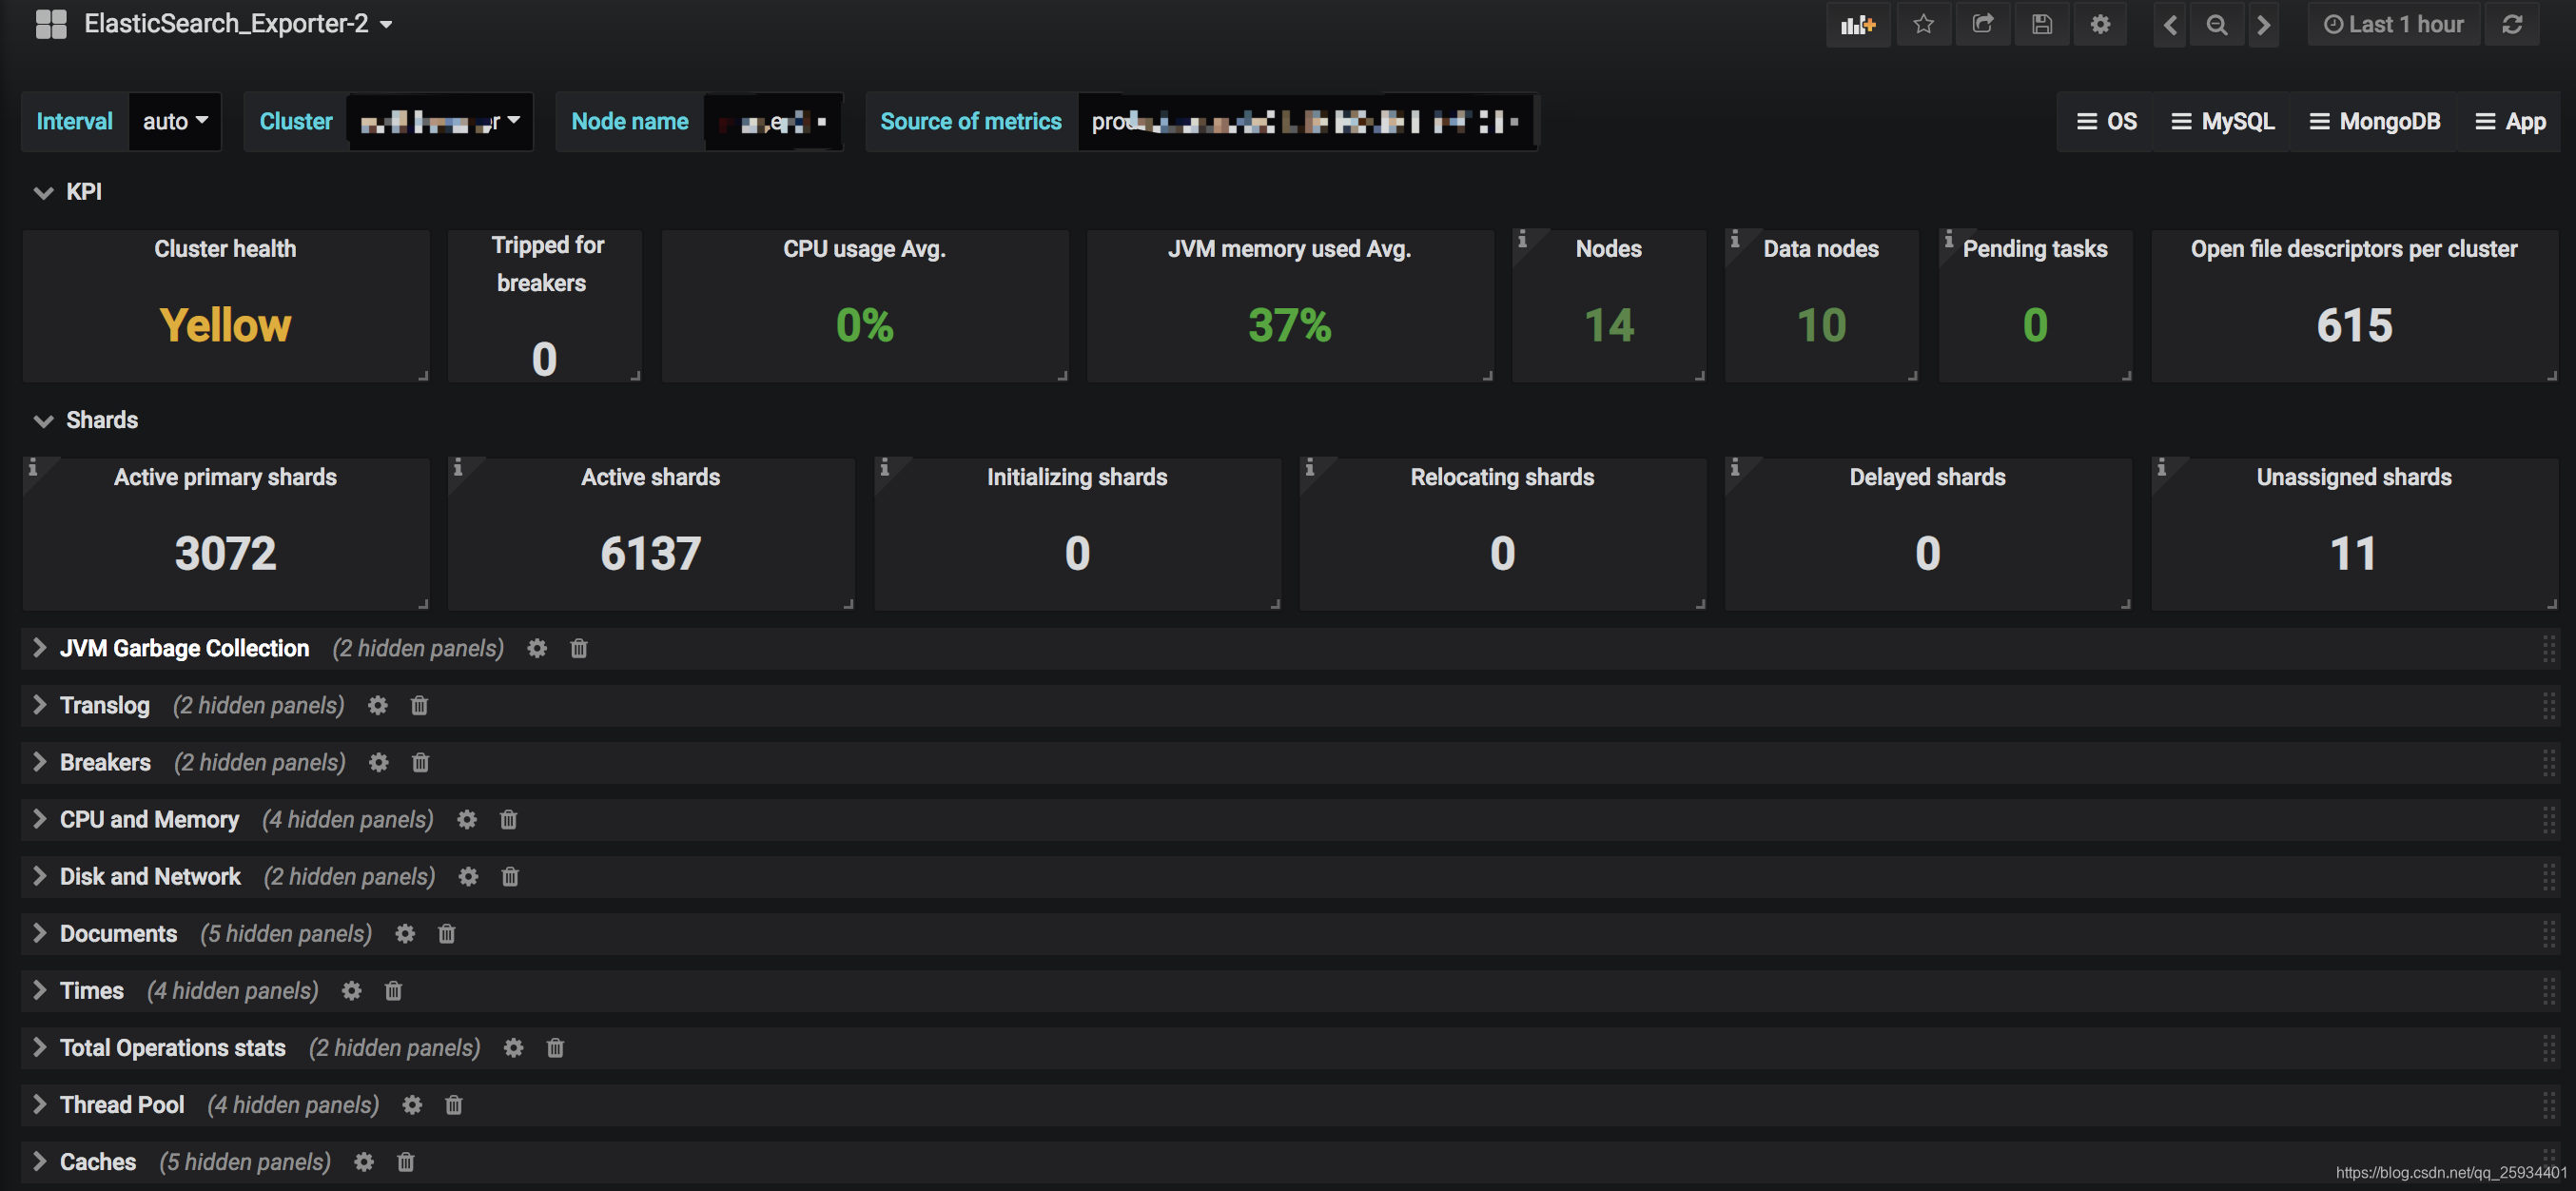
Grafana 畫圖
模版:連結:https://pan.baidu.com/s/1mAtVhko18gD4LxdSkuCGEg 密碼:3mtd
如對你有所幫助 記得點贊呦 ^ _ ^!