python機器學習實戰(一)
原文連結:www.cnblogs.com/fydeblog/p/7140974.html
前言
這篇notebook是關於機器學習中監督學習的k近鄰演算法,將介紹2個例項,分別是使用k-近鄰演算法改進約會網站的效果和手寫識別系統.
作業系統:ubuntu14.04 執行環境:anaconda-python2.7-notebook 參考書籍:機器學習實戰 notebook writer ----方陽
k-近鄰演算法(kNN)的工作原理:存在一個樣本資料集合,也稱作訓練樣本集,並且樣本集中的每個資料都存在標籤,即我們知道樣本集中每一組資料與所屬分類的對應關係,輸入沒有標籤的新資料後,將新資料的每個特徵與樣本集中資料對應的特徵進行比較,然後演算法提取樣本集中特徵最相似的分類標籤。
注意事項:在這裡說一句,預設環境python2.7的notebook,用python3.6的會出問題,還有我的目錄可能跟你們的不一樣,你們自己跑的時候記得改目錄,我會把notebook和程式碼以及資料集放到結尾。
1.改進約會網站的匹配效果
1-1.準備匯入資料
from numpy import *
import operator

def createDataSet():
    group = array([[1.0,1.1],[1.0,1.0],[0,0],[0,0.1]])
    labels = ['A','A','B','B']
    return group, labels
先來點開胃菜,在上面的程式碼中,我們匯入了兩個模組,一個是科學計算包numpy,一個是運算子模組,在後面都會用到,在createDataSet函式中,我們初始化了group,labels,我們將做這樣一件事,[1.0,1.1]和[1.0,1.0] 對應屬於labels中 A 分類,[0,0]和[0,0.1]對應屬於labels中的B分類,我們想輸入一個新的二維座標,根據上面的座標來判斷新的座標屬於那一類,在這之前,我們要 實現k-近鄰演算法
def classify0(inX, dataSet, labels, k):
    dataSetSize = dataSet.shape[0]
    diffMat = tile(inX, (dataSetSize,1)) - dataSet
    sqDiffMat = diffMat**2
    sqDistances = sqDiffMat.sum(axis=1)
    distances = sqDistances**0.5
    sortedDistIndicies = distances.argsort()
    classCount={}
    for i in range(k):
        voteIlabel = labels[sortedDistIndicies[i]]
        classCount[voteIlabel] = classCount.get(voteIlabel,0) + 1
    sortedClassCount = sorted(classCount.iteritems(), key=operator.itemgetter(1), reverse=True)
    return sortedClassCount[0][0]
程式碼解析:
- 函式的第一行是要得到資料集的數目,例如group.shape就是(4,2),shape[0]反應資料集的行,shape[1]反應列數。
- 函式的第二行是array對應相減,tile會生成關於Inx的dataSetSize大小的array,例如,InX是[0,0],則tile(InX,(4,1))是array([[0, 0], [0, 0], [0, 0],[0, 0]]),然後與dataSet對應相減,得到新的array。
- 函式的第三行是對第二步的結果進行平方演算法,方便下一步算距離。
- 函式的第四行是進行求和,注意是axis=1,也就是array每個二維陣列成員進行求和(行求和),如果是axis=0就是列求和。
- 第五行是進行平方距離的開根號。
以上5行實現的是距離的計算 ,下面的是選出距離最小的k個點,對類別進行統計,返回所佔數目多的類別。
classCount定義為儲存字典,裡面有‘A’和‘B’,它們的值是在前k個距離最小的資料集中的個數,本例最後classCount={'A':1,'B':2},函式argsort是返回array陣列從小到大的排列的序號,get函式返回字典的鍵值,由於後面加了1,所以每次出現鍵值就加1,就可以就算出鍵值出現的次數裡。最後通過sorted函式將classCount字典分解為列表,sorted函式的第二個引數匯入了運算子模組的itemgetter方法,按照第二個元素的次序(即數字)進行排序,由於此處reverse=True,是逆序,所以按照從大到小的次序排列。
1-2.準備資料:從文字中解析資料
這上面是k-近鄰的一個小例子,我的標題還沒介紹,現在來介紹標題,準備資料,一般都是從文字檔案中解析資料,還是從一個例子開始吧!
本次例子是改進約會網站的效果,我們定義三個特徵來判別三種類型的人:
- 特徵一:每年獲得的飛行常客里程數
- 特徵二:玩視訊遊戲所耗時間百分比
- 特徵三:每週消費的冰淇淋公升數
根據以上三個特徵:來判斷一個人是否是自己不喜歡的人,還是魅力一般的人,還是極具魅力的人。
於是,收集了1000個樣本,放在datingTestSet2.txt中,共有1000行,每一行有四列,前三列是特徵,後三列是從屬那一類人,於是問題來了,我們這個文字檔案的輸入匯入到python中來處理,於是需要一個轉換函式file2matrix,函式輸入是檔名字字串,輸出是訓練樣本矩陣(特徵矩陣)和類標籤向量。
def file2matrix(filename):
    fr = open(filename)
    numberOfLines = len(fr.readlines())         #get the number of lines in the file
    returnMat = zeros((numberOfLines,3))        #prepare matrix to return
    classLabelVector = []                       #prepare labels return
    fr = open(filename)
    index = 0
    for line in fr.readlines():
        line = line.strip()
        listFromLine = line.split('\t')
        returnMat[index,:] = listFromLine[0:3]
        classLabelVector.append(int(listFromLine[-1]))
        index += 1
    return returnMat,classLabelVector
這個函式比較簡單,就不詳細說明裡,這裡只介紹以下一些函式的功能吧!
- open函式是開啟檔案,裡面必須是字串,由於後面沒加‘w’,所以是讀檔案
- readlines函式是一次讀完檔案,通過len函式就得到檔案的行數
- zeros函式是生成numberOfLines X 3的矩陣,是array型的
- strip函式是截掉所有的回車符
- split函式是以輸入引數為分隔符,輸出分割後的資料,本例是製表鍵,最後輸出元素列表
- append函式是向列表中加入資料
1-3.分析資料:使用Matplotlib建立散點圖
首先,從上一步得到訓練樣本矩陣和類標籤向量,先更換一下路徑。
cd /home/fangyang/桌面/machinelearninginaction/Ch02/
datingDataMat,datingLabels = file2matrix('datingTestSet2.txt')
import matplotlib
import matplotlib.pyplot as plt
fig = plt.figure()
ax =  fig.add_subplot(111)
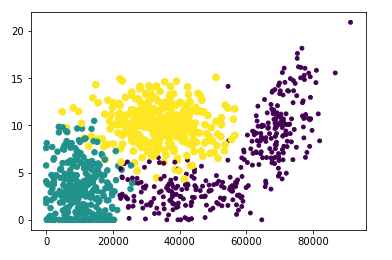
ax.scatter(datingDataMat[:,0], datingDataMat[:,1], 15.0*array(datingLabels), 15.0*array(datingLabels))  #scatter函式是用來畫散點圖的
plt.show()
結果顯示

1-4. 準備資料: 歸一化處理
我們從上圖可以上出,橫座標的特徵值是遠大於縱座標的特徵值的,這樣再算新資料和資料集的資料的距離時,數字差值最大的屬性對計算結果的影響最大,我們就可能會丟失掉其他屬性,例如這個例子,每年獲取的飛行常客里程數對計算結果的影響遠大於其餘兩個特徵,這是我們不想看到的,所以這裡採用歸一化數值處理,也叫特徵縮放,用於將特徵縮放到同一個範圍內。
本例的縮放公式 newValue = (oldValue - min) / (max - min)
其中min和max是資料集中的最小特徵值和最大特徵值。通過該公式可將特徵縮放到區間(0,1)
下面是特徵縮放的程式碼
def autoNorm(dataSet):
    minVals = dataSet.min(0)
    maxVals = dataSet.max(0)
    ranges = maxVals - minVals
    normDataSet = zeros(shape(dataSet))
    m = dataSet.shape[0]
    normDataSet = dataSet - tile(minVals, (m,1))
    normDataSet = normDataSet/tile(ranges, (m,1))   #element wise divide
    return normDataSet, ranges, minVals
normDataSet(1000 X 3)是歸一化後的資料,range(1X3)是特徵的範圍差(即最大值減去最小值),minVals(1X3)是最小值。
原理上面已介紹,這裡不在複述。
1-5.測試演算法:作為完整程式驗證分類器
好了,我們已經有了k-近鄰演算法、從文字解析出資料、還有歸一化處理,現在可以使用之前的資料進行測試了,測試程式碼如下:
def datingClassTest():
    hoRatio = 0.50
    datingDataMat,datingLabels = file2matrix('datingTestSet2.txt')       #load data setfrom file
    normMat, ranges, minVals = autoNorm(datingDataMat)
    m = normMat.shape[0]
    numTestVecs = int(m*hoRatio)
    errorCount = 0.0
    for i in range(numTestVecs):
        classifierResult = classify0(normMat[i,:],normMat[numTestVecs:m,:],datingLabels[numTestVecs:m],3)
        print "the classifier came back with: %d, the real answer is: %d" % (classifierResult, datingLabels[i])
        if (classifierResult != datingLabels[i]): errorCount += 1.0
    print "the total error rate is: %f" % (errorCount/float(numTestVecs))
    print errorCount
這裡函式用到裡之前講的三個函式:file2matrix、autoNorm和classify0.這個函式將資料集分成兩個部分,一部分當作分類器的訓練樣本,一部分當作測試樣本,通過hoRatio進行控制,函式hoRatio是0.5,它與樣本總數相乘,將資料集平分,如果想把訓練樣本調大一些,可增大hoRatio,但最好不要超過0.8,以免測試樣本過少,在函式的最後,加了錯誤累加部分,預測出來的結果不等於實際結果,errorCount就加1,然後最後除以總數就得到錯誤的概率。
說了這麼多,都還沒有測試以下,下面來測試一下!先從簡單的開始(已將上面的函式放在kNN.py中了)
1 import  kNN
2 group , labels = kNN.createDataSet()
group #結果在下
array([[ 1. ,  1.1],
       [ 1. ,  1. ],
       [ 0. ,  0. ],
       [ 0. ,  0.1]])
labels #結果在下
['A', 'A', 'B', 'B']這個小例子最開始提過,有兩個分類A和B,通過上面的group為訓練樣本,測試新的資料屬於那一類
1 kNN.classify0([0,0], group, labels, 3) #使用k-近鄰演算法進行測試
'B' #結果是B分類
直觀地可以看出[0,0]是與B所在的樣本更近,下面來測試一下約會網站的匹配效果。
先將文字中的資料匯出來,由於前面在分析資料畫圖的時候已經用到裡file2matrix,這裡就不重複用了。
datingDataMat #結果在下
array([[  4.09200000e+04,   8.32697600e+00,   9.53952000e-01],
       [  1.44880000e+04,   7.15346900e+00,   1.67390400e+00],
       [  2.60520000e+04,   1.44187100e+00,   8.05124000e-01],
       ...,
       [  2.65750000e+04,   1.06501020e+01,   8.66627000e-01],
       [  4.81110000e+04,   9.13452800e+00,   7.28045000e-01],
       [  4.37570000e+04,   7.88260100e+00,   1.33244600e+00]])
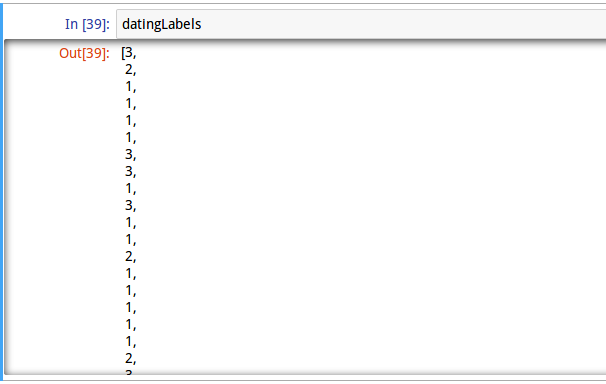
datingLabels #由於過長,只擷取一部分,詳細去看jupyter notebook

然後對資料進行歸一化處理。
1 normMat , ranges , minVals = kNN.autoNorm(datingDataMat) #使用歸一化函式
normMat
array([[ 0.44832535,  0.39805139,  0.56233353],
       [ 0.15873259,  0.34195467,  0.98724416],
       [ 0.28542943,  0.06892523,  0.47449629],
       ...,
       [ 0.29115949,  0.50910294,  0.51079493],
       [ 0.52711097,  0.43665451,  0.4290048 ],
       [ 0.47940793,  0.3768091 ,  0.78571804]])
ranges
array([ 9.12730000e+04, 2.09193490e+01, 1.69436100e+00])
minVals
array([ 0. , 0. , 0.001156])
最後進行測試,執行之前的測試函式datingClassTest
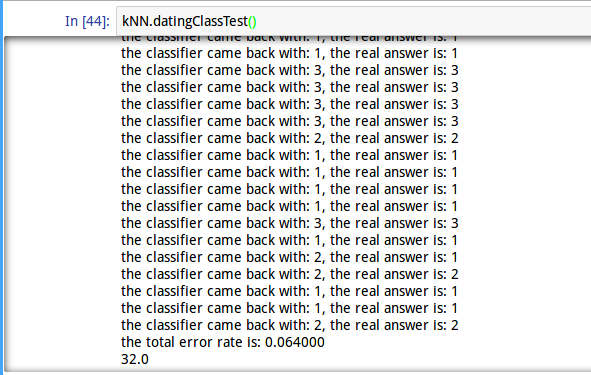
1 kNN.datingClassTest()
由於過長,只擷取一部分,詳細去看jupyter notebook

可以看到上面結果出現錯誤32個,錯誤率6.4%,所以這個系統還算不錯!
1-6.系統實現
我們可以看到,測試固然不錯,但使用者互動式很差,所以結合上面,我們要寫一個完整的系統,程式碼如下:
def classifyPerson():
    resultList = ['not at all', 'in small doses', 'in large doses']
    percentTats = float(raw_input("percentage of time spent playing video games?"))
    ffMiles = float(raw_input("frequent flier miles earned per year?"))
    iceCream = float(raw_input("liters of ice cream consumed per year?"))
    datingDataMat, datingLabels = file2matrix('datingTestSet2.txt')
    normMat, ranges, minVals = autoNorm(datingDataMat)
    inArr = array([ffMiles, percentTats, iceCream])
    classifierResult = classify0((inArr-minVals)/ranges, normMat, datingLabels,3)
    print "You will probably like this person" , resultList[classifierResult - 1]
執行情況
1 kNN.classifyPerson()
percentage of time spent playing video games?10   #這裡的數字都是使用者自己輸入的
frequent flier miles earned per year?10000
liters of ice cream consumed per year?0.5
You will probably like this person in small doses
這個就是由使用者自己輸出引數,並判斷出感興趣程度,非常友好。
2.手寫識別系統
下面再介紹一個例子,也是用k-近鄰演算法,去實現對一個數字的判斷,首先我們是將寬高是32X32的畫素的黑白影象轉換成文字檔案儲存,但我們知道文字檔案必須轉換成特徵向量,才能進入k-近鄰演算法中進行處理,所以我們需要一個img2vector函式去實現這個功能!
img2vector程式碼如下:
def img2vector(filename):
    returnVect = zeros((1,1024))
    fr = open(filename)
    for i in range(32):
        lineStr = fr.readline()
        for j in range(32):
            returnVect[0,32*i+j] = int(lineStr[j])
    return returnVect
這個函式挺簡單的,先用zeros生成1024的一維array,然後用兩重迴圈,外迴圈以行遞進,內迴圈以列遞進,將32X32的文字資料依次賦值給returnVect。
好了,轉換函式寫好了,說一下訓練集和測試集,所有的訓練集都放在trainingDigits資料夾中,測試集放在testDigits資料夾中,訓練集有兩千個樣本,0~9各有200個,測試集大約有900個樣本,這裡注意一點,所有在資料夾裡的命名方式是有要求的,我們是通過命名方式來解析出它的真實數字,然後與通過k-近鄰演算法得出的結果相對比,例如945.txt,這裡的數字是9,連線符前面的數字就是這個樣本的真實資料。該系統實現的方法與前面的約會網站的類似,就不多說了。
系統測試程式碼如下
def handwritingClassTest():
    hwLabels = []
    trainingFileList = listdir('trainingDigits')           #load the training set
    m = len(trainingFileList)
    trainingMat = zeros((m,1024))
    for i in range(m):
        fileNameStr = trainingFileList[i]
        fileStr = fileNameStr.split('.')[0]     #take off .txt
        classNumStr = int(fileStr.split('_')[0])
        hwLabels.append(classNumStr)
        trainingMat[i,:] = img2vector('trainingDigits/%s' % fileNameStr)
    testFileList = listdir('testDigits')        #iterate through the test set
    errorCount = 0.0
    mTest = len(testFileList)
    for i in range(mTest):
        fileNameStr = testFileList[i]
        fileStr = fileNameStr.split('.')[0]     #take off .txt
        classNumStr = int(fileStr.split('_')[0])
        vectorUnderTest = img2vector('testDigits/%s' % fileNameStr)
        classifierResult = classify0(vectorUnderTest, trainingMat, hwLabels, 3)
        print "the classifier came back with: %d, the real answer is: %d" % (classifierResult, classNumStr)
        if (classifierResult != classNumStr): errorCount += 1.0
    print "\nthe total number of errors is: %d" % errorCount
    print "\nthe total error rate is: %f" % (errorCount/float(mTest))
這裡的listdir是從os模組匯入的,它的功能是列出給定目錄下的所有檔名,以字串形式存放,輸出是一個列表
這裡的split函式是要分離符號,得到該文字的真實資料,第一個split函式是以小數點為分隔符,例如‘1_186.txt’ ,就變成了['1_186','txt'],然後取出第一個,就截掉了.txt,第二個split函式是以連線符_為分隔符,就截掉後面的序號,剩下前面的字元資料‘1’,然後轉成int型就得到了它的真實資料,其他的沒什麼,跟前面一樣
下面開始測試
1 kNN.handwritingClassTest()

我們可以看到最後結果,錯誤率1.2%, 可見效果還不錯!
這裡把整個kNN.py檔案貼出來,主要是上面已經介紹的函式
'''
Input:      inX: vector to compare to existing dataset (1xN)
            dataSet: size m data set of known vectors (NxM)
            labels: data set labels (1xM vector)
            k: number of neighbors to use for comparison (should be an odd number)

Output:     the most popular class label
'''

from numpy import *
import operator
from os import listdir

def classify0(inX, dataSet, labels, k):
    dataSetSize = dataSet.shape[0]
    diffMat = tile(inX, (dataSetSize,1)) - dataSet
    sqDiffMat = diffMat**2
    sqDistances = sqDiffMat.sum(axis=1)
    distances = sqDistances**0.5
    sortedDistIndicies = distances.argsort()
    classCount={}
    for i in range(k):
        voteIlabel = labels[sortedDistIndicies[i]]
        classCount[voteIlabel] = classCount.get(voteIlabel,0) + 1
    sortedClassCount = sorted(classCount.iteritems(), key=operator.itemgetter(1), reverse=True)
    return sortedClassCount[0][0]

def createDataSet():
    group = array([[1.0,1.1],[1.0,1.0],[0,0],[0,0.1]])
    labels = ['A','A','B','B']
    return group, labels

def file2matrix(filename):
    fr = open(filename)
    numberOfLines = len(fr.readlines())         #get the number of lines in the file
    returnMat = zeros((numberOfLines,3))        #prepare matrix to return
    classLabelVector = []                       #prepare labels return
    fr = open(filename)
    index = 0
    for line in fr.readlines():
        line = line.strip()
        listFromLine = line.split('\t')
        returnMat[index,:] = listFromLine[0:3]
        classLabelVector.append(int(listFromLine[-1]))
        index += 1
    return returnMat,classLabelVector

def autoNorm(dataSet):
    minVals = dataSet.min(0)
    maxVals = dataSet.max(0)
    ranges = maxVals - minVals
    normDataSet = zeros(shape(dataSet))
    m = dataSet.shape[0]
    normDataSet = dataSet - tile(minVals, (m,1))
    normDataSet = normDataSet/tile(ranges, (m,1))   #element wise divide
    return normDataSet, ranges, minVals

def datingClassTest():
    hoRatio = 0.50      #hold out 10%
    datingDataMat,datingLabels = file2matrix('datingTestSet2.txt')       #load data setfrom file
    normMat, ranges, minVals = autoNorm(datingDataMat)
    m = normMat.shape[0]
    numTestVecs = int(m*hoRatio)
    errorCount = 0.0
    for i in range(numTestVecs):
        classifierResult = classify0(normMat[i,:],normMat[numTestVecs:m,:],datingLabels[numTestVecs:m],3)
        print "the classifier came back with: %d, the real answer is: %d" % (classifierResult, datingLabels[i])
        if (classifierResult != datingLabels[i]): errorCount += 1.0
    print "the total error rate is: %f" % (errorCount/float(numTestVecs))
    print errorCount

def classifyPerson():
    resultList = ['not at all', 'in small doses', 'in large doses']
    percentTats = float(raw_input("percentage of time spent playing video games?"))
    ffMiles = float(raw_input("frequent flier miles earned per year?"))
    iceCream = float(raw_input("liters of ice cream consumed per year?"))
    datingDataMat, datingLabels = file2matrix('datingTestSet2.txt')
    normMat, ranges, minVals = autoNorm(datingDataMat)
    inArr = array([ffMiles, percentTats, iceCream])
    classifierResult = classify0((inArr-minVals)/ranges, normMat, datingLabels,3)
    print "You will probably like this person" , resultList[classifierResult - 1]

def img2vector(filename):
    returnVect = zeros((1,1024))
    fr = open(filename)
    for i in range(32):
        lineStr = fr.readline()
        for j in range(32):
            returnVect[0,32*i+j] = int(lineStr[j])
    return returnVect

def handwritingClassTest():
    hwLabels = []
    trainingFileList = listdir('trainingDigits')           #load the training set
    m = len(trainingFileList)
    trainingMat = zeros((m,1024))
    for i in range(m):
        fileNameStr = trainingFileList[i]
        fileStr = fileNameStr.split('.')[0]     #take off .txt
        classNumStr = int(fileStr.split('_')[0])
        hwLabels.append(classNumStr)
        trainingMat[i,:] = img2vector('trainingDigits/%s' % fileNameStr)
    testFileList = listdir('testDigits')        #iterate through the test set
    errorCount = 0.0
    mTest = len(testFileList)
    for i in range(mTest):
        fileNameStr = testFileList[i]
        fileStr = fileNameStr.split('.')[0]     #take off .txt
        classNumStr = int(fileStr.split('_')[0])
        vectorUnderTest = img2vector('testDigits/%s' % fileNameStr)
        classifierResult = classify0(vectorUnderTest, trainingMat, hwLabels, 3)
        print "the classifier came back with: %d, the real answer is: %d" % (classifierResult, classNumStr)
        if (classifierResult != classNumStr): errorCount += 1.0
    print "\nthe total number of errors is: %d" % errorCount
    print "\nthe total error rate is: %f" % (errorCount/float(mTest))
結尾
至此,這個k-近鄰演算法的介紹到這裡就結束了,希望這篇文章對你的學習有幫助!
百度雲連結: https://pan.baidu.com/s/1OuyOuGi9r8eaPS9gglAzBg
相關文章和視訊推薦
圓方圓學院彙集 Python + AI 名師,打造精品的 Python + AI 技術課程。 在各大平臺都長期有優質免費公開課,歡迎報名收看。
公開課地址:https://ke.qq.com/course/362788
