
How max_prepared_stmt_count bring down the production MySQL system
MySQL Adventures: How max_prepared_stmt_count can bring down production


We recently moved an On-Prem environment to GCP for better scalability and availability. The customer’s main database is MySQL. Due to the nature of customer’s business, it’s a highly transactional workload (one of the hot startups in APAC). To deal with the scale and meet availability requirements, we have deployed MySQL behind ProxySQL — which takes care of routing some of the resource intensive SELECTs to chosen replicas. The setup consists of:
- One Master
- Two slaves
- One Archive database server
Post migration to GCP, everything was nice and calm for a couple of weeks, until MySQL decided to start misbehaving and leading to an outage. We were able to quickly resolve and bring the system back online and what follows are lessons from this experience.
The configuration of the Database:
- CentOS 7.
- MySQL 5.6
- 32 Core CPU
- 120GB Memory
- 1 TB SSD for MySQL data volume.
- The total database size is 40GB. (yeah, it is small in size, but highly transactional)
- All tables are InnoDB Engine
- No SWAP partitions.
The Problem
It all started with an alert that said MySQL process was killed by
Sep 11 06:56:39 mysql-master-node kernel: Out of memory: Kill process 4234 (mysqld) score 980 or sacrifice child
Sep 11 06:56:39 mysql-master-node kernel: Killed process 4234 (mysqld) total-vm:199923400kB, anon-rss:120910528kB, file-rss:0kB, shmem-rss:0kB
Sep 11 06:57:00 mysql-master-node mysqld: /usr/bin/mysqld_safe: line 183: 4234 Killed nohup /usr/sbin/mysqld --basedir=/usr --datadir=/mysqldata --plugin-dir=/usr/lib64/mysql/plugin --user=mysql --log-error=/var/log/mysqld.log --open-files-limit=65535 --pid-file=/var/run/mysqld/mysqld.pid --socket=/mysqldata/mysql.sock < /dev/null > /dev/null 2>&1
Naturally, we started looking at mysql configuration to see if something is off.
InnoDB Parameters:
innodb-flush-method = O_DIRECTinnodb-log-files-in-group = 2innodb-log-file-size = 512Minnodb-flush-log-at-trx-commit = 1innodb-file-per-table = 1innodb-buffer-pool-size = 100G
Other Caching Parameters:
tmp-table-size = 32Mmax-heap-table-size = 32Mquery-cache-type = 0query-cache-size = 0thread-cache-size = 50open-files-limit = 65535table-definition-cache = 4096table-open-cache = 50
We are not really using query cache and one of the heavy front end service is PHP Laravel.
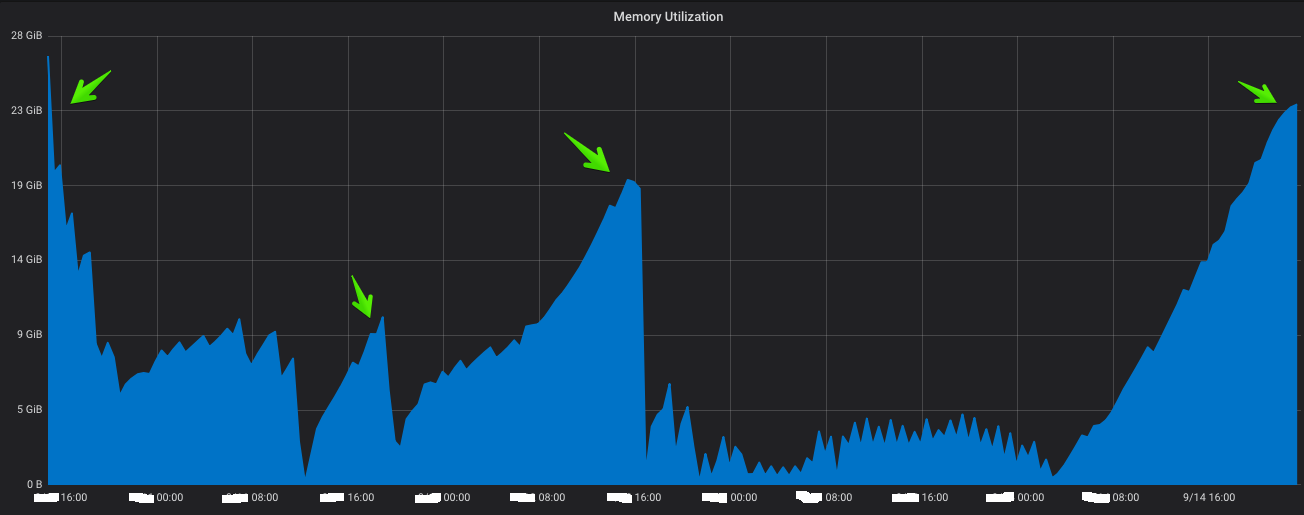
Here is the memory utilization graph.

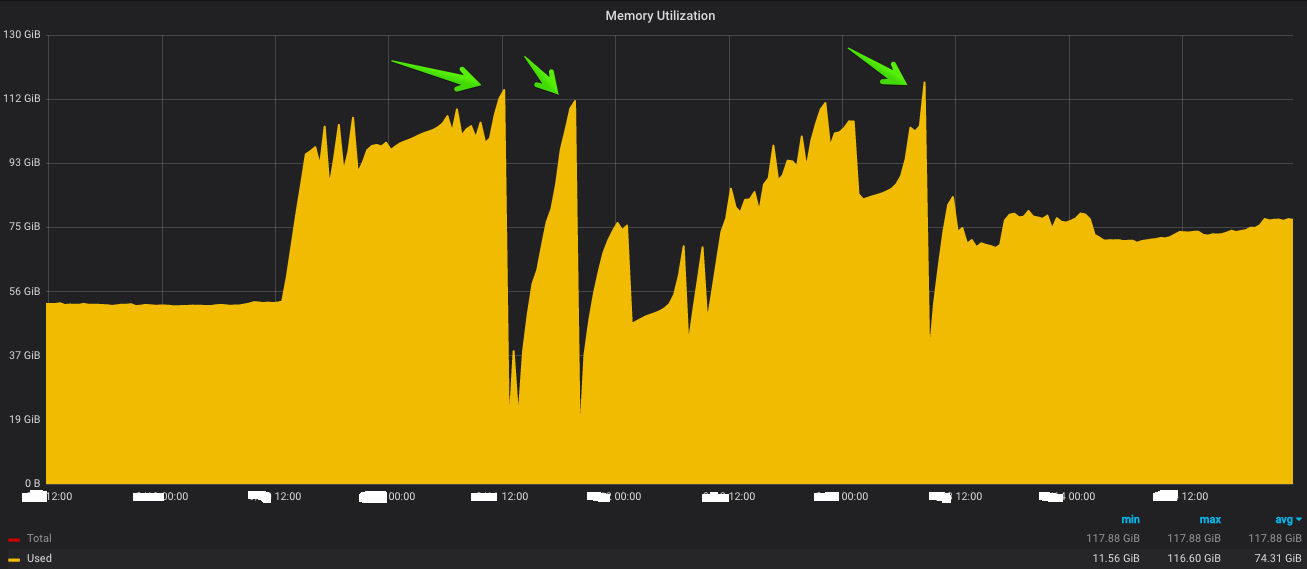
The three highlighted areas are the points at which we had issues in production. The second issue happened very shortly, so we reduced the innodb-buffer-pool-size to 90GB. But even though the memory utilization never came down. So we scheduled a cronjob to flush OS Cache at least to give some addition memory to the Operating system by using the following command. This was a temporary measure till we found the actual problem.
sync; echo 3 > /proc/sys/vm/drop_cache
But This didn’t help really. The memory was still growing and we had to look at what’s really inside the OS Cache?
Fincore:
There is a tool called fincore helped me find out what’s actually the OS cache held. Its actually using Perl modules. use the below commands to install this.
yum install perl-Inline
It never directly shows what files are inside the buffer/cache. We instead have to manually give the path and it’ll check what files are in the cache for that location. I wanted to check about Cached files for the mysql data directory.
cd /mysql-data-directory
fincore -summary * > /tmp/cache_results
Here is the sample output of the cached files results.
page size: 4096 bytesauto.cnf: 1 incore page: 0dbadmin: no incore pages.Eztaxi: no incore pages.ibdata1: no incore pages.ib_logfile0: 131072 incore pages: 0 1 2 3 4 5 6 7 8 9 10......ib_logfile1: 131072 incore pages: 0 1 2 3 4 5 6 7 8 9 10......mysql: no incore pages.mysql-bin.000599: 8 incore pages: 0 1 2 3 4 5 6 7mysql-bin.000600: no incore pages.mysql-bin.000601: no incore pages.mysql-bin.000602: no incore pages.mysql-bin.000858: 232336 incore pages: 0 1 2 3 4 5 6 7 8 9 10......mysqld-relay-bin.000001: no incore pages.mysqld-relay-bin.index: no incore pages.mysql-error.log: 4 incore pages: 0 1 2 3mysql-general.log: no incore pages.mysql.pid: no incore pages.mysql-slow.log: no incore pages.mysql.sock: no incore pages.ON: no incore pages.performance_schema: no incore pages.mysql-production.pid: 1 incore page: 0
6621994 pages, 25.3 Gbytes in core for 305 files; 21711.46 pages, 4.8 Mbytes per file.

How we investigated this issue:
The first document that everyone refers is How mysql uses the memory from MySQL’s documentation. So we started with where are all the places that mysql needs memory. I’ll explain this about in a different blog. Lets continue with the steps which we did.
Make sure MySQL is the culprit:
Run the below command and this will give you the exact memory consumption about MySQL.
ps --no-headers -o "rss,cmd" -C mysqld | awk '{ sum+=$1 } END { printf ("%d%s\n", sum/NR/1024,"M") }'119808M
Additional Tips:
If you want to know each mysql’s threads memory utilization, run the below command.
# Get the PID of MySQL:ps aux | grep mysqld
mysql 4378 41.1 76.7 56670968 47314448 ? Sl Sep12 6955:40 /usr/sbin/mysqld --basedir=/usr --datadir=/mysqldata --plugin-dir=/usr/lib64/mysql/plugin --user=mysql --log-error=/var/log/mysqld.log --open-files-limit=65535 --pid-file=/var/run/mysqld/mysqld.pid --socket=/mysqldata/mysql.sock
# Get all threads memory usage:pmap -x 4378
4378: /usr/sbin/mysqld --basedir=/usr --datadir=/mysqldata --plugin-dir=/usr/lib64/mysql/plugin --user=mysql --log-error=/var/log/mysqld.log --open-files-limit=65535 --pid-file=/var/run/mysqld/mysqld.pid --socket=/mysqldata/mysql.sockAddress Kbytes RSS Dirty Mode Mapping0000000000400000 11828 4712 0 r-x-- mysqld000000000118d000 1720 760 476 rw--- mysqld000000000133b000 336 312 312 rw--- [ anon ]0000000002b62000 1282388 1282384 1282384 rw--- [ anon ]00007fd4b4000000 47816 37348 37348 rw--- [ anon ]00007fd4b6eb2000 17720 0 0 ----- [ anon ]00007fd4bc000000 48612 35364 35364 rw--- [ anon ]...........................00007fe1f0075000 2044 0 0 ----- libpthread-2.17.so00007fe1f0274000 4 4 4 r---- libpthread-2.17.so00007fe1f0275000 4 4 4 rw--- libpthread-2.17.so00007fe1f0276000 16 4 4 rw--- [ anon ]00007fe1f027a000 136 120 0 r-x-- ld-2.17.so00007fe1f029c000 2012 2008 2008 rw--- [ anon ]00007fe1f0493000 12 4 0 rw-s- [aio] (deleted)00007fe1f0496000 12 4 0 rw-s- [aio] (deleted)00007fe1f0499000 4 0 0 rw-s- [aio] (deleted)00007fe1f049a000 4 4 4 rw--- [ anon ]00007fe1f049b000 4 4 4 r---- ld-2.17.so00007fe1f049c000 4 4 4 rw--- ld-2.17.so00007fe1f049d000 4 4 4 rw--- [ anon ]00007ffecc0f1000 132 72 72 rw--- [ stack ]00007ffecc163000 8 4 0 r-x-- [ anon ]ffffffffff600000 4 0 0 r-x-- [ anon ]---------------- ------- ------- ------- total kB 122683392 47326976 47320388
InnoDB Buffer Pool:
Initially we suspected the InnoDB. We have checked the innoDB usage from the monitoring system. But the result was negative. It never utilized more than 40GB. That thickens the plot. If buffer pool only has 40 GB, who is eating all that memory?

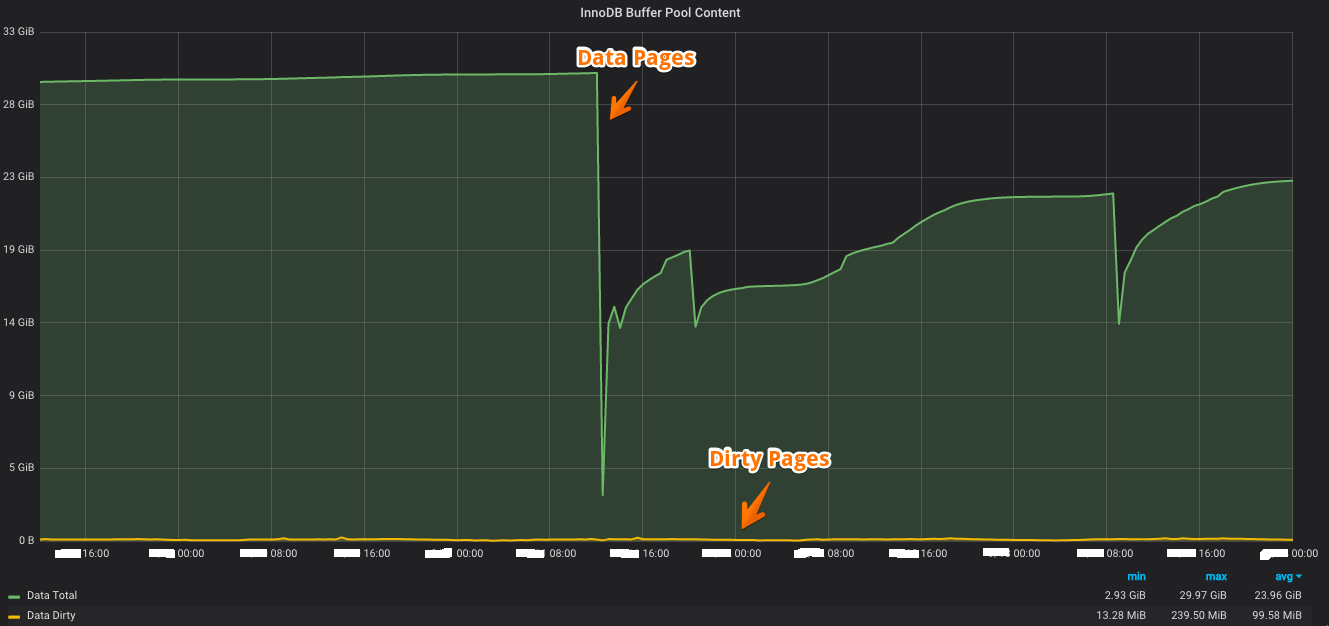
Is this correct? Does Buffer Pool only hold 40GB?
What’s Inside the BufferPool and whats its size?
SELECT page_type AS page_type, sum(data_size) / 1024 / 1024 AS size_in_mbFROM information_schema.innodb_buffer_pageGROUP BY page_typeORDER BY size_in_mb DESC;
+-------------------+----------------+| Page_Type | Size_in_MB |+-------------------+----------------+| INDEX | 39147.63660717 || IBUF_INDEX | 0.74043560 || UNDO_LOG | 0.00000000 || TRX_SYSTEM | 0.00000000 || ALLOCATED | 0.00000000 || INODE | 0.00000000 || BLOB | 0.00000000 || IBUF_BITMAP | 0.00000000 || EXTENT_DESCRIPTOR | 0.00000000 || SYSTEM | 0.00000000 || UNKNOWN | 0.00000000 || FILE_SPACE_HEADER | 0.00000000 |+-------------------+----------------+
A quick guide about this query.
- INDEX: B-Tree index
- UNKNOWN: not allocated / unknown state
- TRX_SYSTEM: transaction system data
Bonus:
To get the buffer pool usage by index
SELECT table_name AS table_name, index_name AS index_name, count(*) AS page_count, sum(data_size) / 1024 / 1024 AS size_in_mbFROM information_schema.innodb_buffer_pageGROUP BY table_name, index_nameORDER BY size_in_mb DESC;