
Large-scale Graph Mining with Spark
Graphs 101
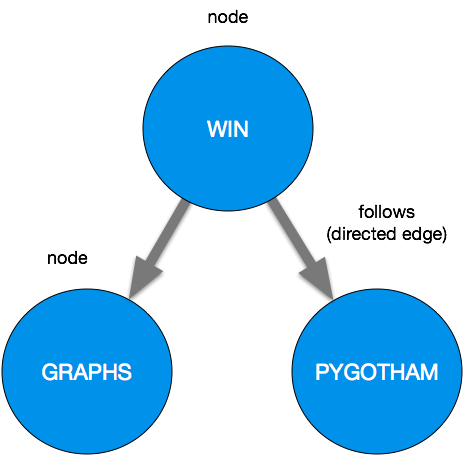
A graph is a data structure for representing pairwise relationships between objects. Graphs are comprised of nodes (also called vertices) and edges. They can also be directed or undirected. For instance, Twitter follows can be a directed graph; the relationship is one-way. Just because I follow another user, doesn’t mean they follow me!

I focus on web graphs. Web graphs capture link relationships between different websites. Each webpage is a node. If there is an html link from one page to another, draw an edge between those two nodes.
As you do this for more and more pages, you’ll notice substructures emerge. On real web data, these substructures can be quite large and complex!
Here’s a sample graph of all the pages under a single news site.
- Each light blue dot represents a single webpage, or node.
- Each dark blue line represents a link between 2 pages, an edge.

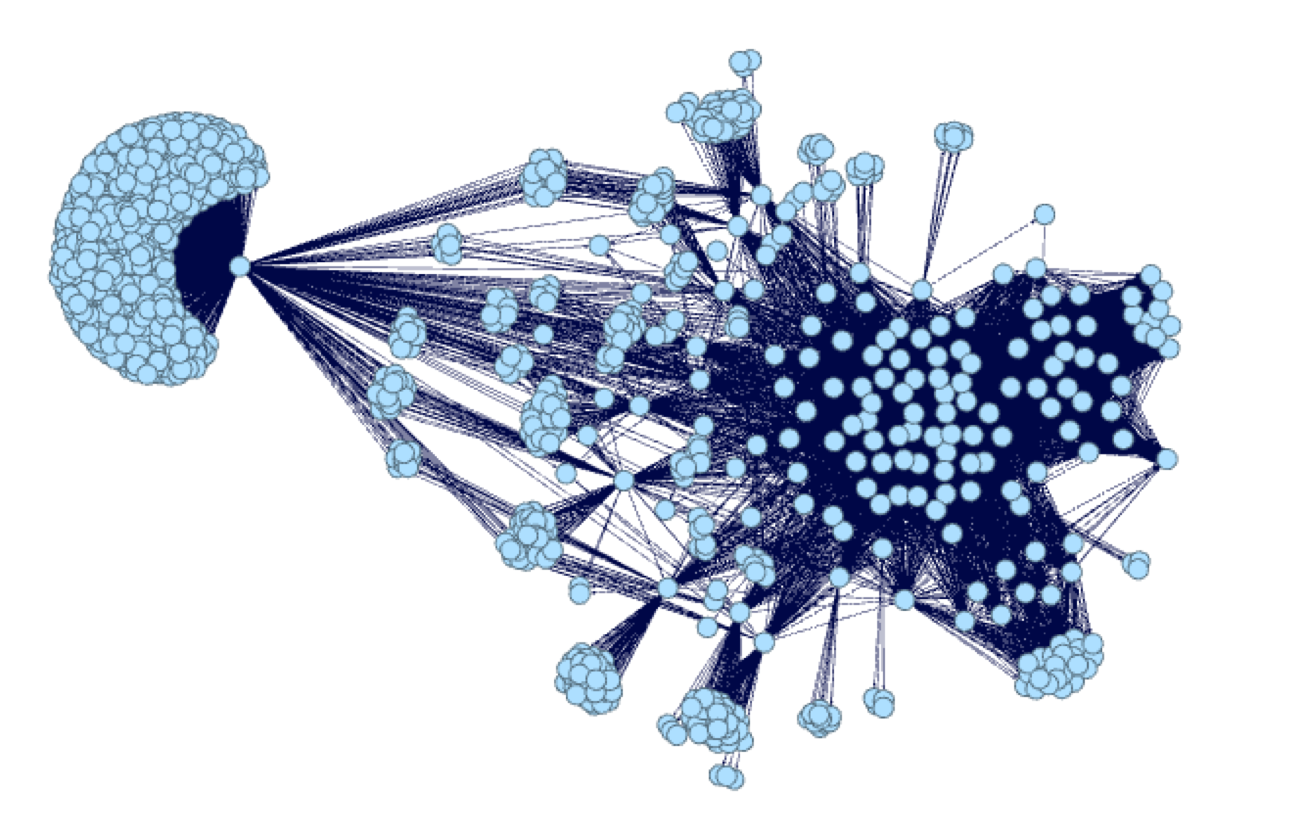
Even at this level, you can see dense clusters, or communities,
If a single site is so dense with connections, imagine what we can mine from tens of thousands of sites!
Why are graphs useful?
OK, that blue jellyfish thingy looks cool and all, but why even do all this?
-you
There are many machine learning problems where labels (information on whether a data point is of one class or another) are not available. Unsupervised learning problems rely on finding similarities between data points to classify data into groups or clusters. Contrast this with supervised approaches, where data is labelled with the appropriate class and your model learns to differentiate classes using these labels.
Unsupervised learning is very useful when you can’t easily get more data, so you leverage more value out of what data you do have. Labels can be unavailable; even if they are, they may be too time-consuming or expensive to obtain. At the start of a machine learning problem, we also may not know exactly how many classes of objects we are looking for!
Here’s why we want graphs in our toolkit:
Graphs allow us to get more value from our data in an unsupervised setting. We can get clusters from graphs.
Unsupervised learning is not unlike how humans learn! How did you first learn to tell the difference between dogs and cats? I’d guess for most people, no one sat your young self down and defined in precise taxonomic terms what a dog or cat was. Nor did your parents give you a corpus of thousands of cat and dog photos, each labelled, and ask you to draw a decision boundary that accurately divides the two classes of animals.
If your childhood was anything like mine, you probably met a few cats and met a few dogs. All the while, your young mind identified the salient differences between the 2 animals, as well as relevant common traits within each type of animal. Our brains are incredible at soaking up information from our environment, synthesizing this data, and formulating commonalities between the vastly different things we come across over the course of our lives.
There are many exciting applications of clustering. A few examples that come up in my work:
- Predicting class labelsfor datasets where there were no labels to learn from.
- Generate grouping for audience segmentation and classification.
- Build a recommender for similar web sites.
- Find anomalies.
- Use clusters as part of a semi-supervised machine learning ensemble. Clusters can help you extend know labels to nearby data points to increase training data size, or they can be used outright if labels are needed immediately until a secondary system can classify them.
Here’s the kicker: in unsupervised learning, clusters are communities! And communities are clusters!
Graph communities are clusters too!
The only difference is, instead of using engineered features, you’re relying on the underlying network structure in your graph to derive clusters. Instead of a predefined distance metric, you use edges in your graph to measure similarity between data points.