Customizing Kubernetes Logging (Part 1)
Customizing Kubernetes Logging (Part 1)
One of the most powerful tools at your disposal when debugging applications in production are the logs. They’re very easy to create, give you the freedom to output whatever you want, and relatively easy to use. However, every developer likes their own output format, which can make consuming logs in a structured or consistent way difficult for those responsible for troubleshooting or analytics across services, applications, and even Kubernetes clusters. Let’s take a very simple example — outputting a value.
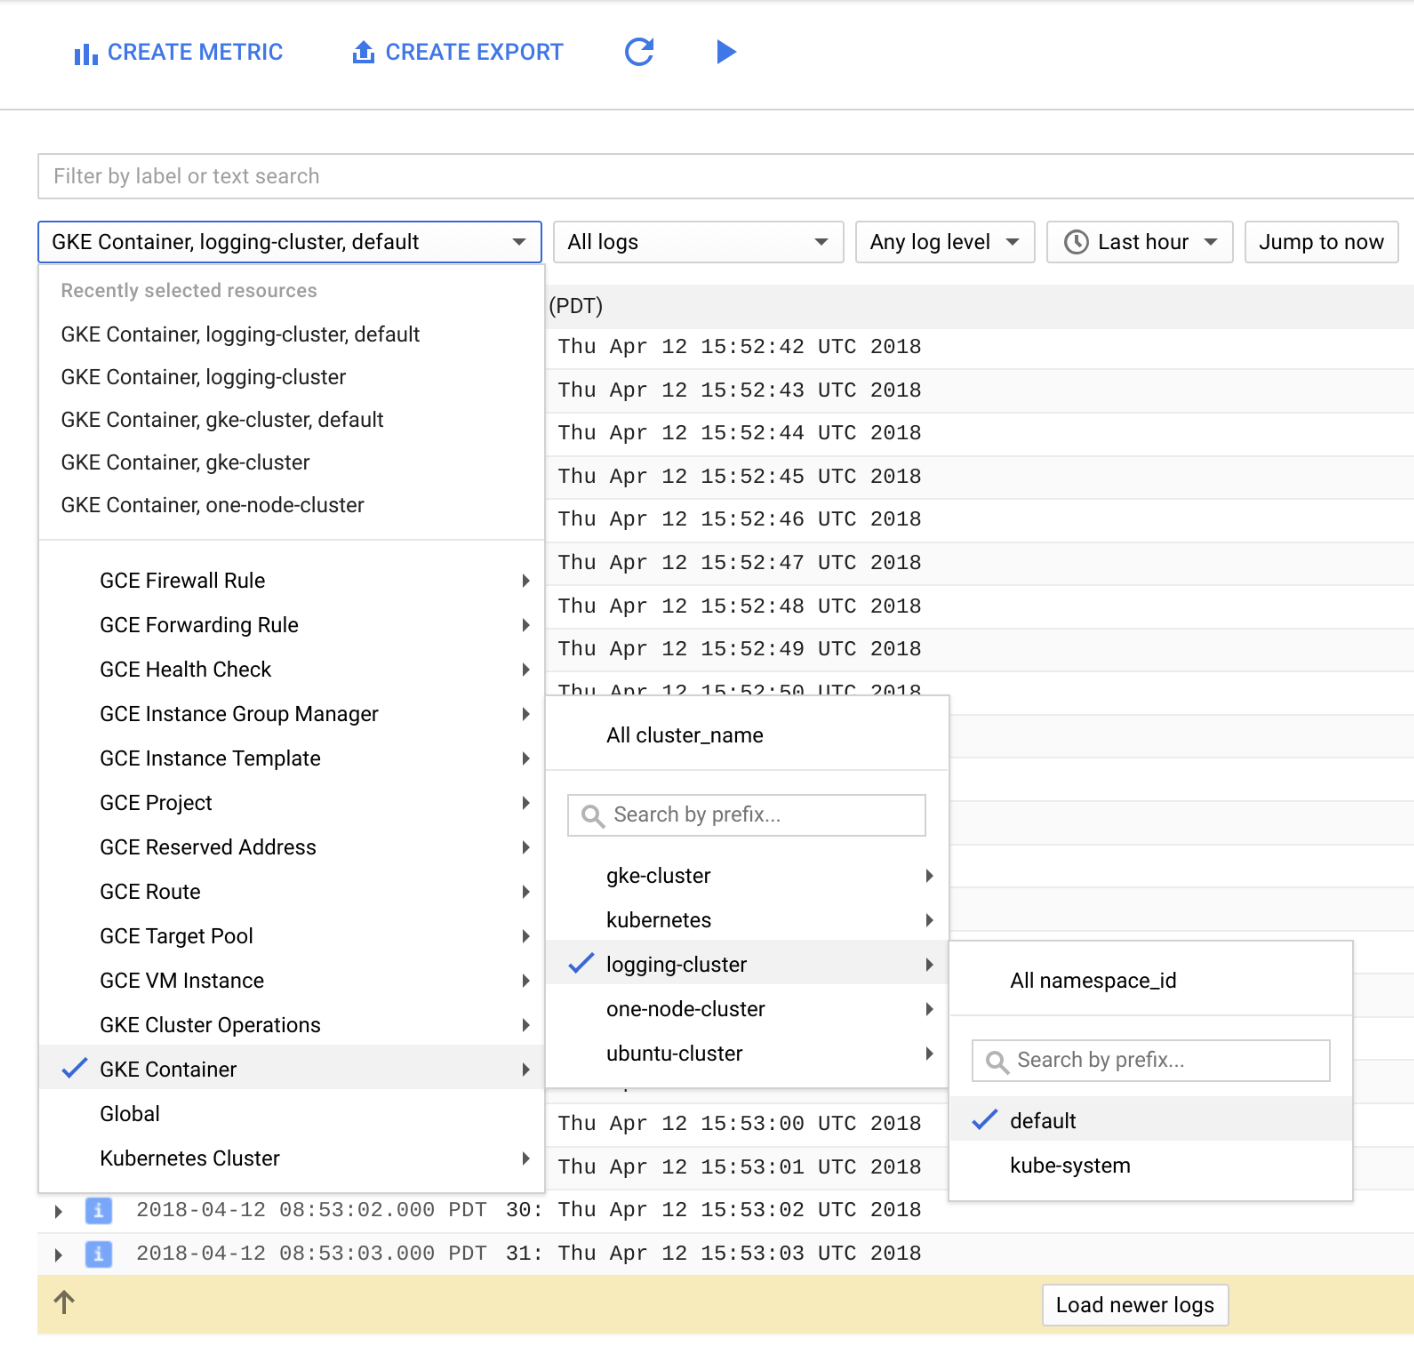
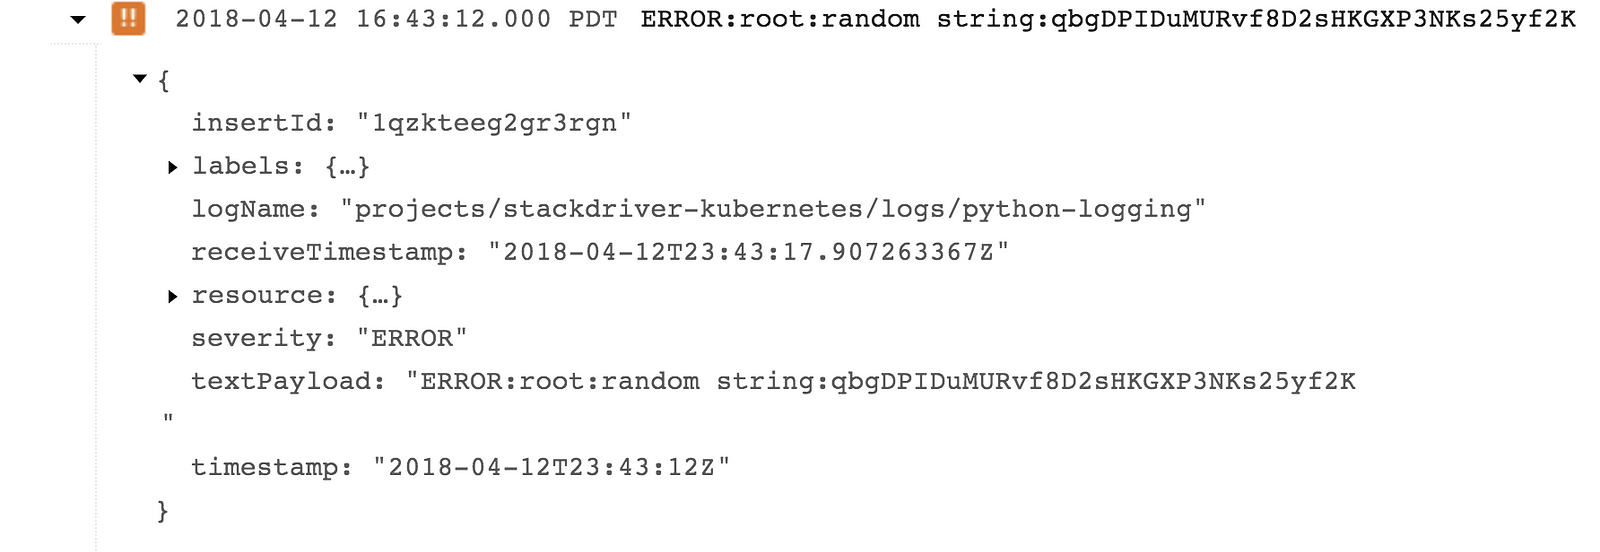
I decided to use this opportunity to expand my meager Python skills and have created a simple app that does very little other than randomly generating logging messages. Specifically, it outputs a simple colon-delimited message that looks like this (as shown in the default Stackdriver Logging viewer without any modifications):
logging.error(“myError:” + randomString)
or
logging.warn("myWarning:" + randomString)The actual message that I care about has two parts — the part before and after the colon. Specifically, I would like to know whether there is a difference in values for errors and warnings! Ideally, I just want to send all the logs to BigQuery and do my analysis there — but the entire payload is in a single field called textPayload
Well, thankfully, Stackdriver has recently started supporting structured logging, and you can read all about it here. There’s another blog post that does a great job of describing the overall value of structured logging, too. For our purposes here — we want to use structured logging to break up a single line into multiple fields using regular expressions. The bad news — the existing instructions are only for the logging agent running on virtual machines. Let’s see if we can make this work on Kubernetes?
0 — Set up cluster and deploy (“new”) logging
Deploying Stackdriver logging on a GKE cluster is easy and well documented here. I won’t rehash the instructions here, but I followed them precisely, and I suggest you do the same. I’m going to assume that you have created your cluster and set up your kubectl context and credentials from this point on.
1 — Deploy the application
Now that we have a cluster, we need something running on it to generate the logs of the kind I’m discussing here. I’ve made my (please don’t judge me too harshly) code available on GitHub. Let’s deploy it to our cluster.
First, we’ll clone the repo:
Next, we’ll build the container image using Cloud Build (after setting the project_id variable):
$ gcloud container builds submit --tag gcr.io/${project_id}/python-logging:latest
and validate that it worked by checking the Build History in Cloud Build -> Build History:


Now, we are ready to deploy. I’ve provided the (very simple) .yaml file I’m using in the repo.
$ kubectl create -f ./python-logging.yamldeployment "python-logging" created
Now, let’s make sure we can access the deployment by creating a load balancer in front of it and testing it:
$ kubectl expose deployment python-logging --type=LoadBalancerservice "python-logging" exposed
$ kubectl get servicesNAME TYPE CLUSTER-IP EXTERNAL-IP PORT(S) AGEkubernetes ClusterIP 10.47.240.1 <none> 443/TCP 47mpython-logging LoadBalancer 10.47.240.242 <your IP> 5000:32361/TCP 32s
$ curl http://<your IP>:5000myDebug:4903403857
At this point, we can look at the logs to confirm the problem we’re looking to solve.


2 — Deploy Own Custom Logging
Now comes the fun part. We’re going to modify the configMap for the Stackdriver Logging deployment to include a new filter pattern to break up our log entry into separate fields.
First, let’s see what our Logging Agent deployment has created:
$ kubectl get nsNAME STATUS AGEdefault Active 11dkube-public Active 11dkube-system Active 11dstackdriver-agents Active 3d
$ kubectl get cm -n stackdriver-agentsNAME DATA AGEcluster-config 2 3dgoogle-cloud-config 1 3dlogging-agent-config 4 3d
$ kubectl get ds -n stackdriver-agentsNAME DESIRED CURRENT READY UP-TO-DATE AVAILABLE NODE SELECTOR AGEstackdriver-logging-agent 3 3 3 3 3 <none> 3dstackdriver-metadata-agent 3 3 3 3 3 <none> 3d
Now, we need to get the .yaml file that will let us modify this configuration. It’s available in the public Stackdriver GitHub repository here. As per the instructions there, you’ll want to recompile the agents.yaml file after making changes to the logging-agent.yaml file.
Another option would be to simply pull down the config file from the deployment by doing something like this:
$ kubectl get cm logging-agent-config -n stackdriver-agents -o yaml >> cm.yaml
and the deploymentSet:
$ kubectl get ds stackdriver-logging-agent -n stackdriver-agents -o yaml >> ds.yaml
This could potentially cause issues if the configuration doesn’t “round-trip” well, so my recommendation would be to use the files from the repository, instead.
We won’t need to modify the deploymentSet at all, but we will change the configMap to include a new filter to process our log entries. Modify the cm.yaml file to add the filter for Python output under `containers.input.conf: |-` (add the 3 lines in bold).
<filter reform.**> @type parser format multi_format <pattern> format /^(?<severity>.*):(?<logger>.*):(?<outputName>.*):(<outputValue>.*)/ </pattern> <pattern> format /^(?<severity>\w)(?<time>\d{4} [^\s]*)\s+(?<pid>\d+)\s+(<source>[^ \]]+)\] (?<log>.*)/ </pattern> <pattern> format none </pattern> reserve_data true # note that this doubles the size of the log, as both parsed and unparsed data would be kept. Set to “false” if you only care about the unparsed data. suppress_parse_error_log true key_name log</filter>Create the new configMap and redeploy agents:
$ kubectl replace -f ./cm.yaml --force && kubectl delete pods -n stackdriver-agents -l app=stackdriver-logging-agent
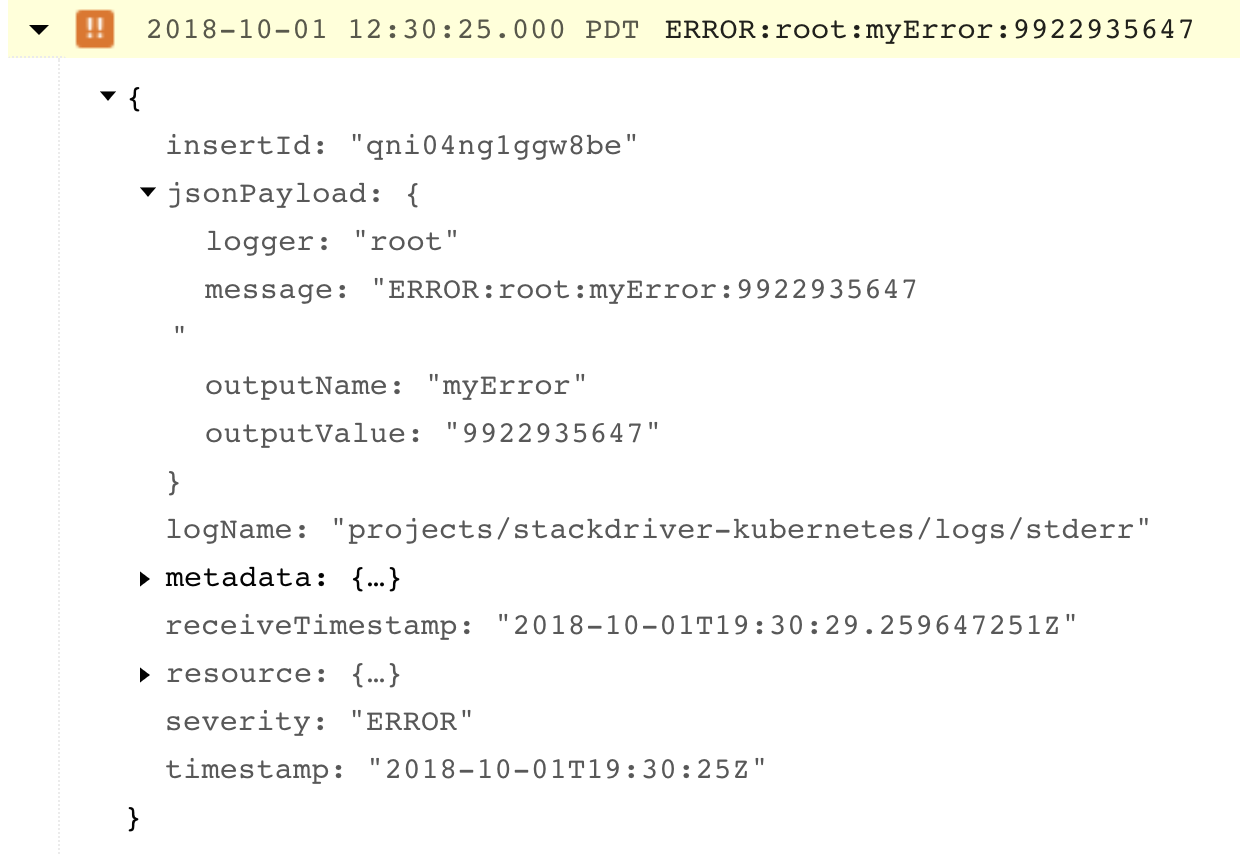
That’ll take about a minute. Once it’s done, you can try to refresh your application URL and check Stackdriver Logging again. Your logs should now look like this — note that we now have a jsonPayload field with the values we care about separated out.


3 — Now What?
So, our logs are now structured! What does this actually let me do? Well, let’s export these to BigQuery and see what we get there.


Two things to note there:
a. A dataset and table have been created — in my case, the table was created for the log and named with today’s date.
b. each of the fields in jsonPayload is a separate column in the table!
Now, we can do all sorts of fun things! I’m just going to show a basic BigQuery query to average all the values when the message is just a warning:


You can surely take it from here, but I wanted to show how it’s possible to customize the logging configuration on a GKE cluster and use Stackdriver Logging to produce structured logs!
In Part 2, my plan is to revisit this basic approach and investigate how to
- Deploy using a Helm chart
- Manage filters across a larger fleet of clusters and deployments
Wish me luck!
Resources
