1. 程式人生 > >matlab控制影象的邊界(margin),subplot的間距(gap)

matlab控制影象的邊界(margin),subplot的間距(gap)

使用subplot(row, col, i)建立的子圖,matlab會隱式地調整它們的間距以及它們和整個figure的邊距,以達到它所認為的美觀或者合理的設定,然而如果我們想根據需求設定合理的間距以及邊距,該怎麼定製呢?

這裡提供一個函式(是在沒必要把時間花費在這種繁瑣的格式上):

function ha = tight_subplot(Nh, Nw, gap, marg_h, marg_w)

% tight_subplot creates "subplot" axes with adjustable gaps and margins
%
% ha = tight_subplot(Nh, Nw, gap, marg_h, marg_w)
%
%   in
: Nh number of axes in hight (vertical direction) % Nw number of axes in width (horizontaldirection) % gap gaps between the axes in normalized units (0...1) % or [gap_h gap_w] for different gaps in height and width % marg_h margins in height in normalized units (0.
..1) % or [lower upper] for different lower and upper margins % marg_w margins in width in normalized units (0...1) % or [left right] for different left and right margins % % out: ha array of handles of the axes objects % starting from upper left corner, going row-wise as in
% going row-wise as in % % Example: ha = tight_subplot(3,2,[.01 .03],[.1 .01],[.01 .01]) % for ii = 1:6; axes(ha(ii)); plot(randn(10,ii)); end % set(ha(1:4),'XTickLabel',''); set(ha,'YTickLabel','') % Pekka Kumpulainen 20.6.2010 @tut.fi % Tampere University of Technology / Automation Science and Engineering if nargin<3; gap = .02; end if nargin<4 || isempty(marg_h); marg_h = .05; end if nargin<5; marg_w = .05; end if numel(gap)==1; gap = [gap gap]; end if numel(marg_w)==1; marg_w = [marg_w marg_w]; end if numel(marg_h)==1; marg_h = [marg_h marg_h]; end axh = (1-sum(marg_h)-(Nh-1)*gap(1))/Nh; axw = (1-sum(marg_w)-(Nw-1)*gap(2))/Nw; py = 1-marg_h(2)-axh; ha = zeros(Nh*Nw,1); ii = 0; for ih = 1:Nh px = marg_w(1); for ix = 1:Nw ii = ii+1; ha(ii) = axes('Units','normalized', ... 'Position',[px py axw axh], ... 'XTickLabel','', ... 'YTickLabel',''); px = px+axw+gap(2); end py = py-axh-gap(1); end
  • 1
  • 2
  • 3
  • 4
  • 5
  • 6
  • 7
  • 8
  • 9
  • 10
  • 11
  • 12
  • 13
  • 14
  • 15
  • 16
  • 17
  • 18
  • 19
  • 20
  • 21
  • 22
  • 23
  • 24
  • 25
  • 26
  • 27
  • 28
  • 29
  • 30
  • 31
  • 32
  • 33
  • 34
  • 35
  • 36
  • 37
  • 38
  • 39
  • 40
  • 41
  • 42
  • 43
  • 44
  • 45
  • 46
  • 47
  • 48
  • 49
  • 50
  • 51
  • 52
  • 53
  • 54
  • 55
  • 56
  • 57
  • 58
  • 59
  • 60
  • 61

tight\_subplot(Nh, Nw, gap, marg\_h, marg_w)
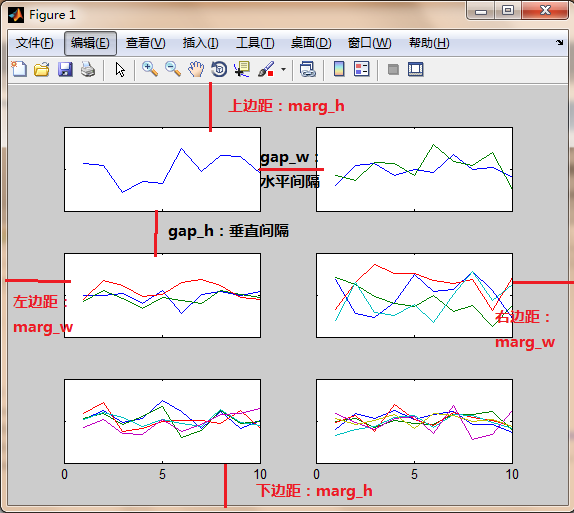
我們先來介紹引數的含義:Nh, Nw用法同subplot(row, col)表示行數和列數,gap(如[0.01, 0.1])表示子圖之間垂直方向和水平方向的間隔,marg_h表示的是全部子圖到figure上下邊界的距離,marg_w則表示的是全部子圖到figure左右邊界的距離。
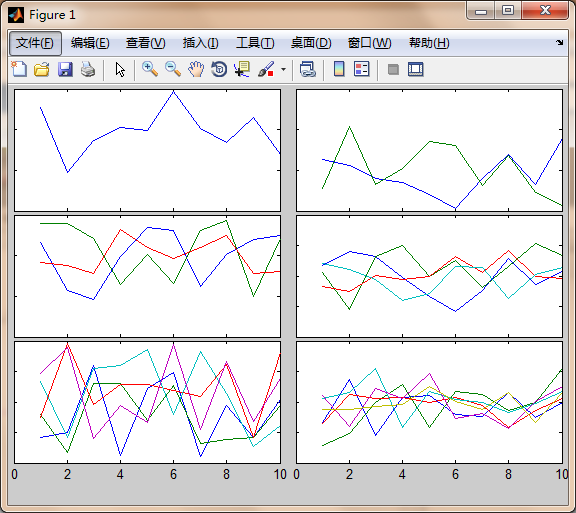


這裡寫圖片描述


一個例項:

ha = tight_subplot(3,2,[.01 .03],[.1 .01],[.01 .01])
for ii = 1:6; 
    axes(ha(ii)); 
    plot(randn(10,ii)); 
end
set(ha(1:4),'XTickLabel',''); 
set(ha,'YTickLabel','')
  • 1
  • 2
  • 3
  • 4
  • 5
  • 6
  • 7


這裡寫圖片描述


如果不是plot繪製的影象,而是imshow()顯示的影象資訊,使用也是如此,

  • 建立全部子圖的控制代碼,hs = tight_subplot(N, N)

  • 用子圖各自的控制代碼建立各自的座標軸,axes(hs(i))

  • 在每個座標軸上顯示影象資訊,imshow()

N
hs = tight_subplot(N, N, [0.01, 0.01], [0.01, 0.01], [0.01, 0.01]);
for i = 1:N*N,
    axes(hs(i));
    imshow(...);
end
  • 1
  • 2
  • 3
  • 4
  • 5
  • 6

References

[1] <tight_subplot>

[2] Matlab中控制影象顯示邊界,subplot間距等

再分享一下我老師大神的人工智慧教程吧。零基礎!通俗易懂!風趣幽默!還帶黃段子!希望你也加入到我們人工智慧的隊伍中來!https://www.cnblogs.com/captainbed