
Multivolume rendering in Jupyter with ipyvolume: cross
Some datasets are intrinsically volumetric cubes. In radio astronomy two of the axes are sky coordinates, and a third axis is the frequency axis, forming a 3d intensity cube of (usually) emission. In medical imaging, the three axes are most usually just the spatial dimensions.
Multivolume rendering
Sometimes, multiple large datasets or multiple data cubes need to be rendered in the same scene. They could be overlapping, fully, partially, or not at all. To make things even more complex, a different volume rendering technique called

Glue to Glue-Jupyter
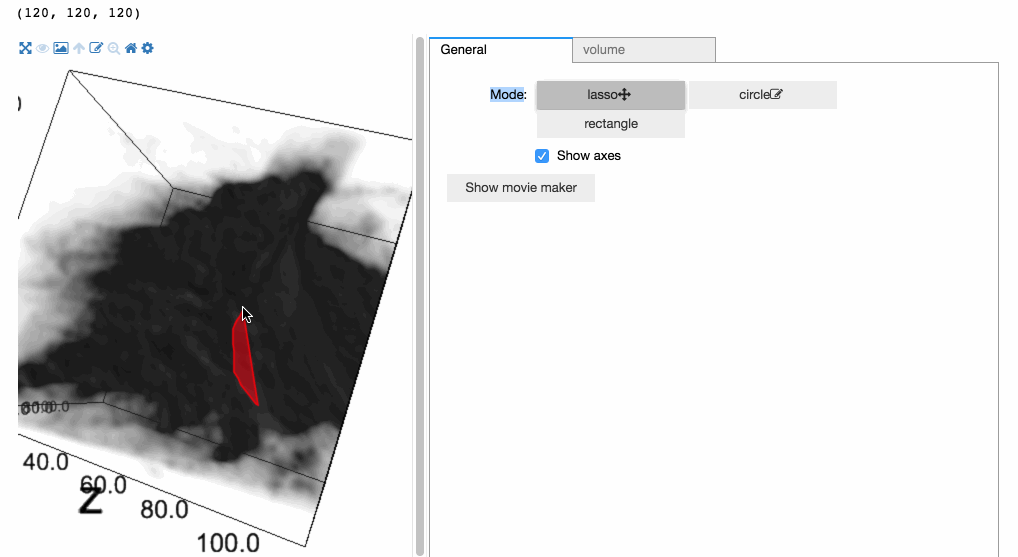
Glue is a desktop application for multi-dimensional linked-data exploration and uses multivolume rendering in its 3D visualizations, for instance, to visualize 3D selections (as demonstrated in the above screencast). Glue-jupyter (a project I am working on) aims to bring glue to the Jupyter notebook. It, therefore, requires a solution for multivolume rendering in the Jupyter notebook.
Ipyvolume is the best 3D visualization package for the Jupyter notebook (disclaimer: I am the main author ;). With ipyvolume, you can do scatter plots, quiver plots, and multivolume rendering in one scene, with just a few lines of code, it does not get any easier!

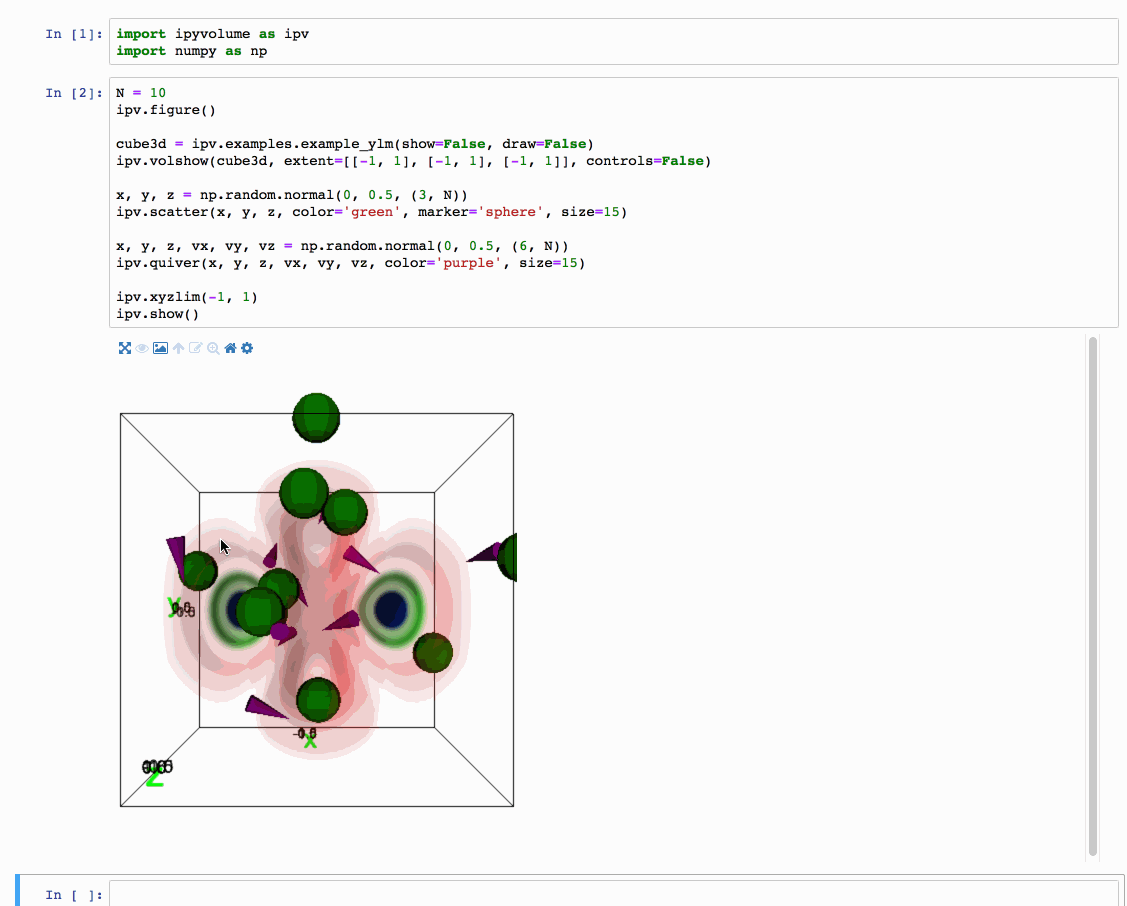
Moreover, ipyvolume is built on top of ipywidgets (Jupyter widgets for the frontend part), giving you all the features that it provides out of the box. Examples render live in the documentation, plots are easy to embed on a static HTML file, the ability to easily link properties together on the frontend (browser) or kernel side (Python process), and listen to any change of a property (a byproduct of the bidirectional communication). Also, ipyvolume reuses pythreejs, exposing a large part of the threejs API for free! And using ipywebrtc, we can record movies, stream them to a remote computer or take snapshots.

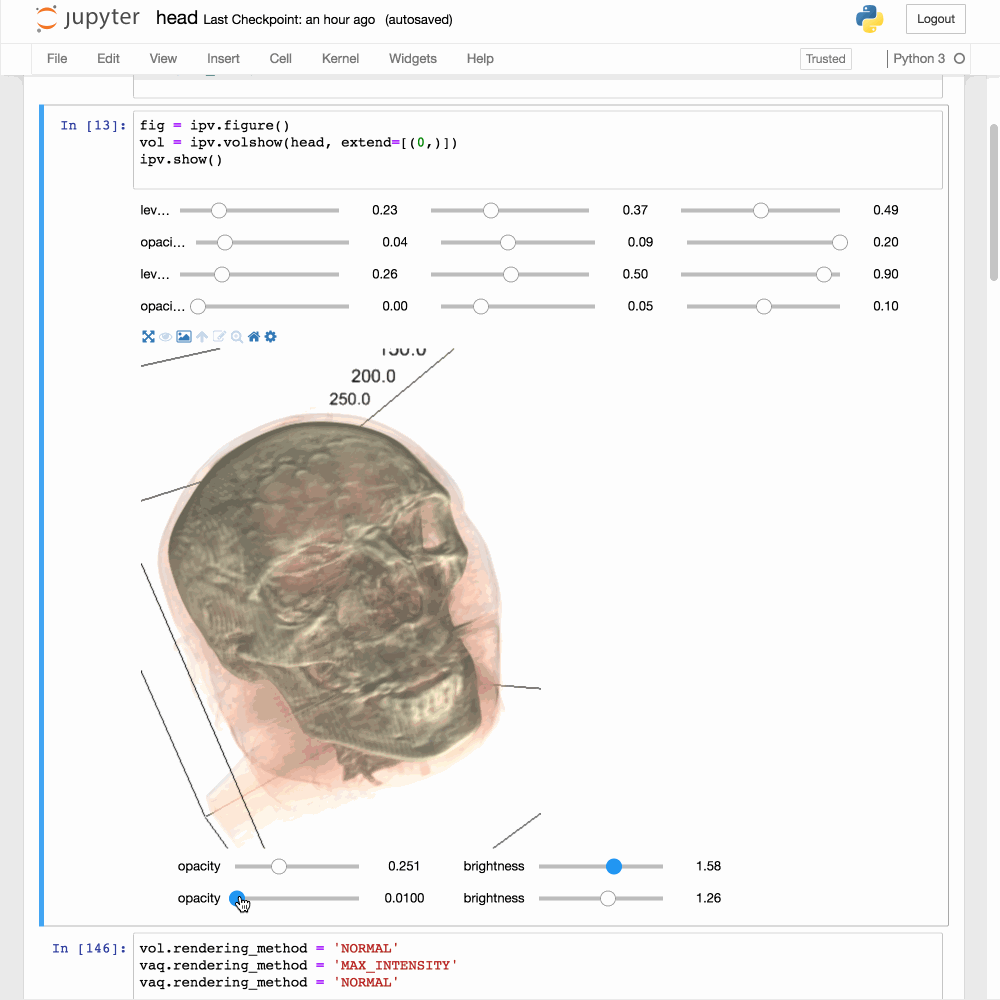

As of version 0.5, ipyvolume supports multi-volume rendering, allowing you to visualize two datasets on top of each other. In the example on the left, we show a scan of a human head and at the same time a 3D histogram of the particles in a dark matter simulation. Any number of data cubes can be put in the same scene, a big feat for visualization in the Jupyter ecosystem! As far as I know, it is the first package to do the multivolume rendering for Jupyter.
What about large data cubes?
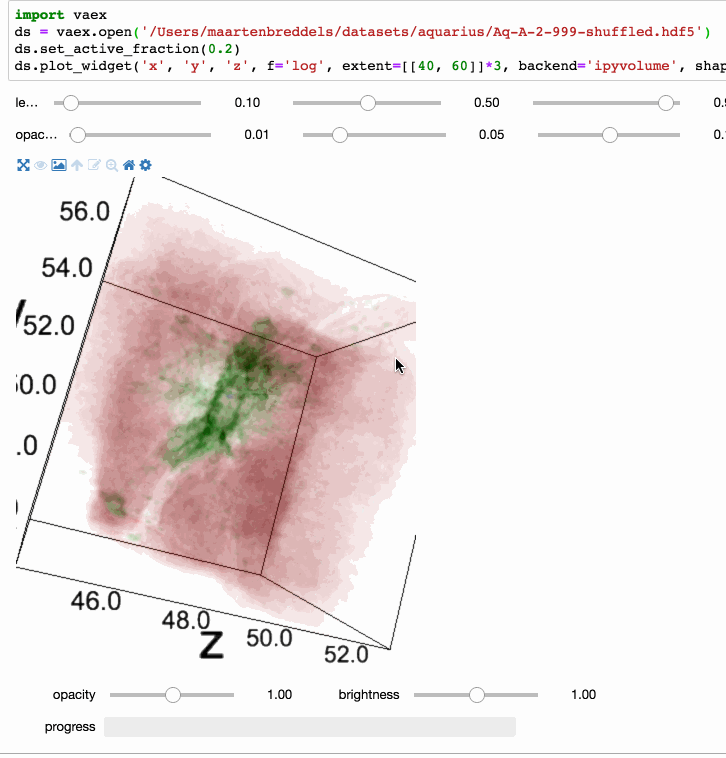
In case you are using a remote Jupyter notebook, possible using Jupyter Hub, you will have the best of two worlds: your code is close to the data and the visualization is local on your laptop/desktop. However, that means that the data needs to be transferred to the client/browser, which for large data cubes can be considerable (yeah, anything to the power 3 is usually large). To solve this, ipyvolume will send a low resolution data cube by default to the browser. If you zoom in, a change in the coordinates of the bounding box is detected (yay ipywidgets!), and a zoomed in higher resolution cutout version will be sent to the browser.

Cross-Language
The joy does not stop here, since most of the code of ipyvolume is frontend code (JavaScript) that runs in the browser, and there is not much preventing us from using it for another language. The BeakerX team at Two Sigma have already shown it can be used from all the JVM languages (Java, Clojure, Groovy, Scala, …).
Now together with the QuantStack team, we are building xvolume, a C++ binding to the frontend code of ipyvolume (yeah, I should rename that to jupyter-volume right?).
This means that with a single code base (plus some per-language glue) we can have a serious 3D visualization package (ipyvolume) for many languages in the Jupyter notebook.
TL;DR version / Conclusion
As of ipyvolume 0.5, we have a serious 3D visualization package for the Jupyter ecosystem that can even do multivolume rendering with mixed rendering techniques, combined with regular meshes, scatter and quiver plots. Reusing the front-end code, and being a Jupyter widget, we can reuse the library in all the JVM languages and C++.