Predicting with Uncertainty: Using Age Prediction Models to detect Brain Abnormalities
Age Prediction Models: Strengths & Shortcomings
Age prediction models are an attractive tool to be exploited for measuring brain abnormality due to its simplicity and because models can be trained using only images of healthy controls without having to recruit patients suffering from a specific condition, especially that recruiting specific patient cohorts is a costly and often impossible process. The trained model, afterward, can predict the age of test subjects by measuring the prediction error between healthy controls and individuals diagnosed with a specific condition. Such models could identify brain anomalies as they begin to develop; enabling doctors with predictive insights to proceed with patient treatment before the actual symptoms are visible.
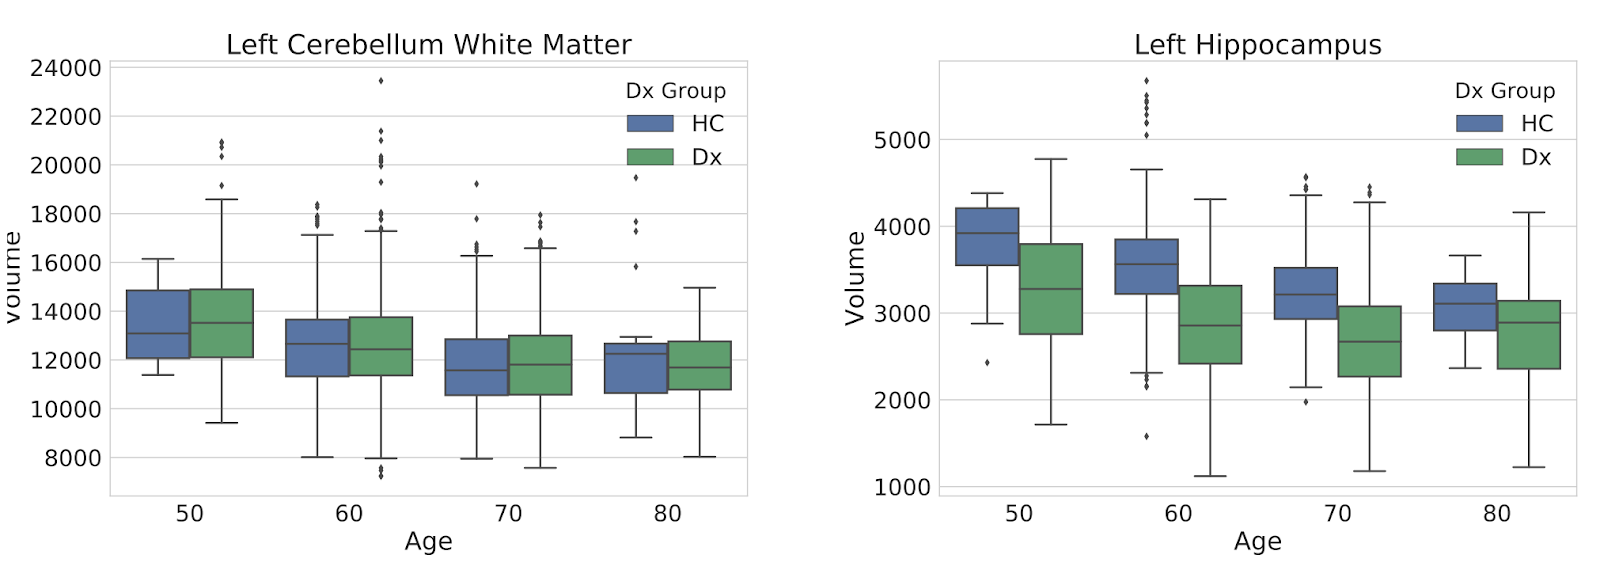
The problem, however, is how age prediction models strongly assume that brain changes caused by diseases are similar to the typical changing patterns related to brain aging. It is partially true that many diseases have similar degenerative patterns as aging for some brain structures, but diseases generally do not affect the whole brain in the same way that aging does
An example of this is Alzheimer’s disease. Over a 50-year span, the volume of many brain structures, including the cerebellum (the area responsible for physical movement) and the hippocampus (which plays an essential role for long-term memory) consistently decrease. This decrease in the hippocampus volume is accelerated for individuals with Alzheimer’s disease; making the hippocampus of a 60-year old have a similar volume like that of a healthy 80-year old person. However, this accelerated aging


Uncertainty to measure Brain Abnormalities more efficiently
Diseases and aging affect the brain differently. So, how can we then use age prediction models to assess brain abnormalities more efficiently? In our recent paper: “Gaussian Process Uncertainty in Age Estimation as a Measure of Brain Abnormality,”we propose using prediction uncertainty instead of prediction error as a measure of abnormality.
What is prediction uncertainty?
Prediction uncertainty can be described as how confident a model is about a prediction. Generally, a model will have low uncertainty values when the test point is very similar to previously seen training examples; whereas it would have high uncertainty values for test points that are different from the training set.
In our case, we measure uncertainty using a Gaussian Process Regression (GPR) model. In a GPR model, the uncertainty of the predictions is measured by examining the density of samples of the training set falling in a specific region of the feature space. This means that a GPR model will be more confident about a prediction if it has already seen many similar cases before. On the other hand, if we ask for a prediction on a testing case that is entirely different from the training samples, we will still get a prediction, but with a high level of uncertainty.
Visualizing Our Uncertainty-based Measurements
Going back to our Alzheimer’s disease example, you can see in the video below an example of how our uncertainty-based framework operates. First, image-based features are collected from a set of healthy individuals (blue dots in the scatter plot). Given these training samples, we can then calculate an uncertainty map of the predictor at each point of the feature space (shaded area: blue corresponds to low uncertainty; red to high uncertainty). See how those areas with many samples correspond to areas with low levels of uncertainty? We assume that areas with low uncertainty levels correspond to areas with common-looking brains.

Finally, we perform age prediction on test subjects. Crosses correspond to healthy individuals and circles to individuals diagnosed with Alzheimer’s disease. In our experiments, we observed that predictions on healthy individuals tend to stay in areas with low uncertainty (the blueish area); while individuals with Alzheimer’s disease tend to drift towards areas with higher uncertainties (red areas). This happens because the features extracted from healthy individuals are generally similar to those in the training set; whereas individuals diagnosed with Alzheimer’s disease tend to have abnormal brain development, making their brains look different from those in the training set.
