
Spurious Correlations in Election Data
Spurious Correlations in Election Data
U.S elections generate a LOT of data, and often times well-meaning analysts attempt to try and glean something more from election data other than just who won and whose votes they got. Fraud, arguably the most important thing to detect in an election, is frequently something that people attempt to discern by analyzing election returns, especially as US election until recently have provided very little in the way of corroborating evidence. I myself have done
Unfortunately, it is not uncommon for people with preconceived notions about why elections went they way they did to attempt to analyze election data to confirm their expectations. This can easily lead people to see things in election data that isn’t there, or for which there is a more simple explanation. This seems to be the case with the particular genre of election fraud sleuthing focused on analyzing election data through the law of large numbers.
In general, the argument goes that voters should be fairly randomly dispersed in precincts, so that the proportion of votes a candidate gets in one precinct should be approximately the same as the proportion they get in another precinct. If voters and vote are randomly distributed, then precinct size also should not interfere with this being true. When we order precincts by size and then sum vote totals for each candidate, we expect the lines to be fairly flat if our assumption about precincts and voter distribution is accurate. Something like this:

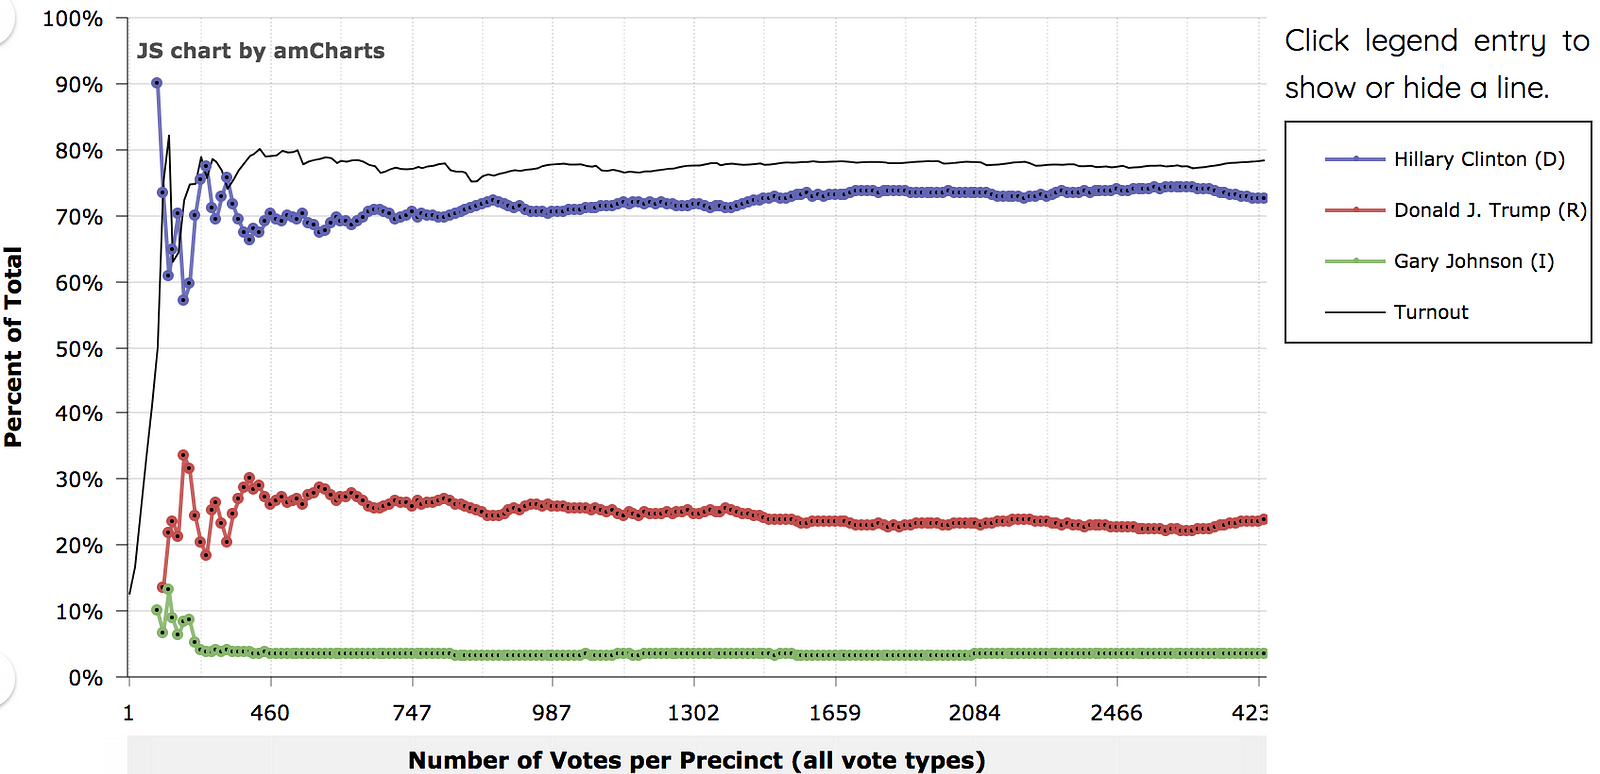
However, as many people have pointed out (VoteSleuth, Choquette and Johnson, and Beth Clarkson, to name a few), this is often not the case:

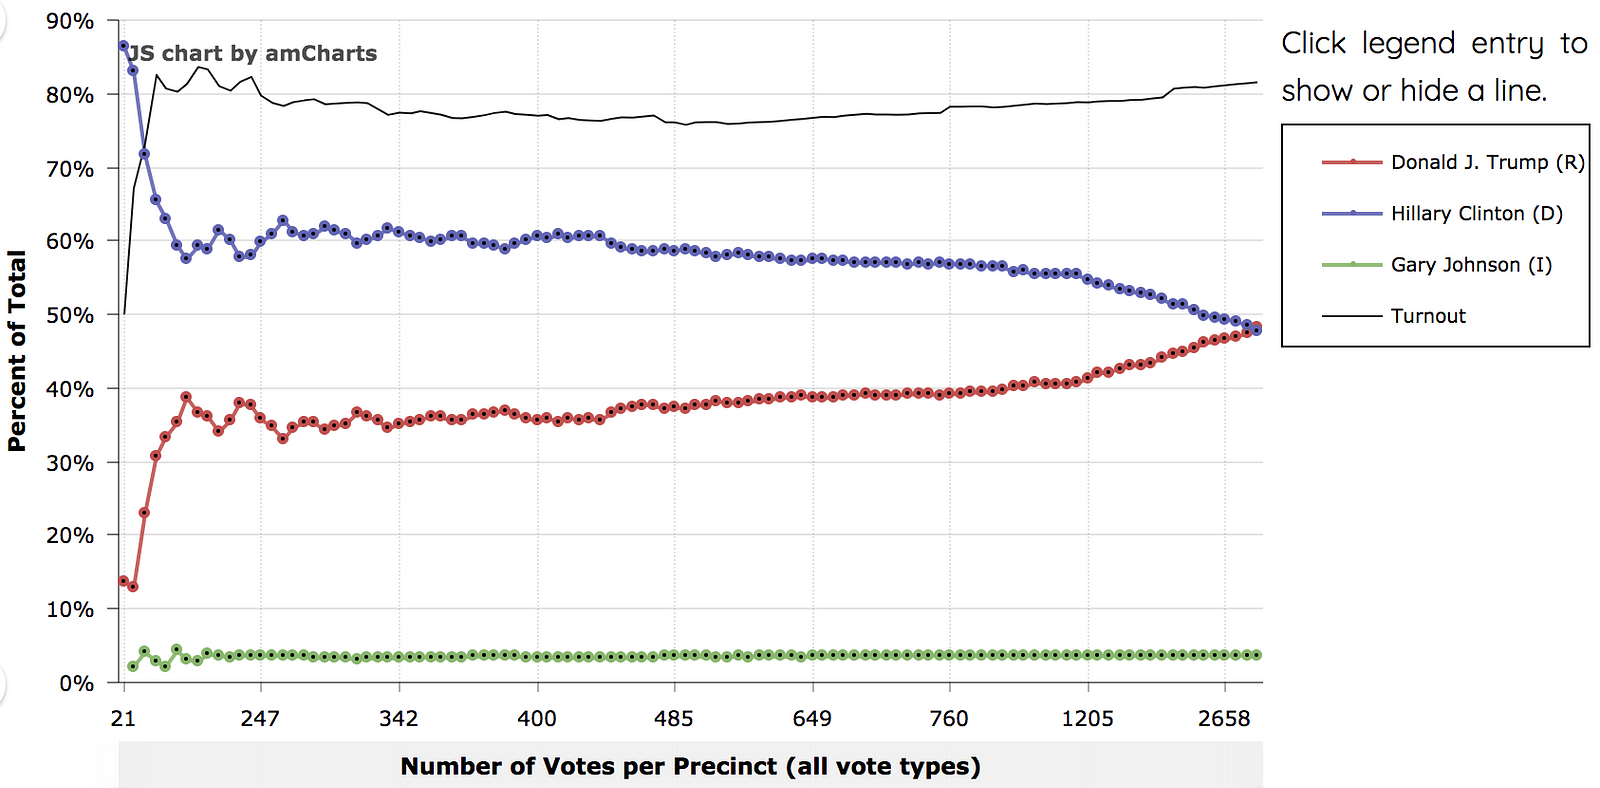
As these folks are quick to point out, this graph indicates that in larger precincts, Republicans tend to get a higher proportion of votes. In the Choquette and Johnson paper, they even control for demographics and find that this effect persists. Many, like VoteSleuth and UnhackTheVote, take this to mean that elections are systematically rigged in favor of Republicans.
However, as other have pointed out (here, here, and here), this misses half of what these graphs tell us. They also tell us that Democrats do better in smaller precincts. Are Democrats systematically rigging small precincts for themselves?
In any event, these effects are curious, and it is worth determining whether this effect is due to fraud of some kind, or if it is just an endemic property of elections, or a coincidence. As someone who works in election security, and as the claims being made by proponents of this analysis circulate around the fraud hypothesis, that is what I want to address here.
In short, there is no evidence that suggests that this effect is due to fraud. In fact, through the 2016 election and subsequent recounts, we actually have evidence that refutes the idea that fraud causes this effect. Both Michigan and Wisconsin did some form of recount by hand. The recounts were far from perfect: Wisconsin didn’t recount all its votes by hand, and Michigan only recounted 43% of its ballots before the recount was shut down. However, we do have data from these recounts that we can use to compare against VoteSleuth’s predictions about fraud.
Many counties in both states were completely recounted by hand. As Choquette and Johnson note in their paper, the most likely avenue for committing fraud is by hacking electronic voting machines to yield the desired result. As such, a hand recount should reliably detect electronic fraud: if the fraud occurred in a way that changed the outcome of the election, a hand recount should easily provide evidence to that fact.
According to VoteSleuth’s analysis, if the larger-precinct-more-Republican trend is indicative of fraud, it would mean that the number of votes that may have been fraudulently changed is at least the amount of deviation from the expected trend of the same proportion of votes regardless of precinct size. Using their example of Milwaukee County (on their home page), they expect something like 85,000 votes (20% of the votes cast in Milwaukee County) would have been manipulated, as a conservative estimation, since the margin deviates in large precincts by about 20%.
Unfortunately we cannot use Milwaukee County as a counterexample, because their recount was conducted by machine. But we can use other counties in Wisconsin and Michigan (data can be found here and here, respectively). Kenosha County, posited by VoteSleuth as one of the most fraudulent counties, recounted entirely by hand.

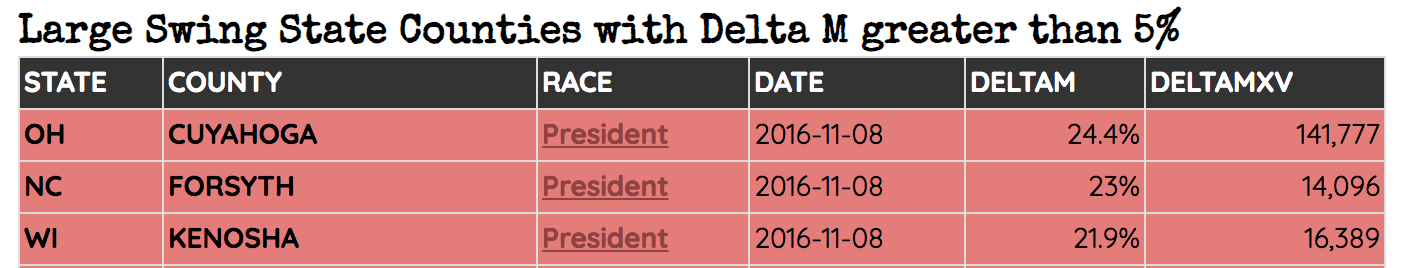
According to VoteSleuth, a conservative estimate is that around 16,000 votes were manipulated. If we assume that they were manipulated by hacking the optical scan machines used in Kenosha County, then the recount should have found about 16,000 paper ballots whose vote differed from the electronic record. In fact, according to the recount data, only 772 votes changed. Both Clinton and Trump gained votes in the recount in Kenosha County, with Clinton gaining 28 votes to Trump’s 12. In short, nowhere near the 16,000 votes predicted by VoteSleuth.
A similar story applies in other Wisconsin counties and in Michigan. In several of the counties identified by VoteSleuth as potentially fraudulent, like Genesee, Ottawa, Ingaham, and others, we see a similar story. Vote changes due to the recount come nowhere even remotely close to VoteSleuth’s predictions.
If one were set on explaining these correlations as fraud, another possible reasonable explanation would be physical ballot stuffing. However, the sheer number of ballots that would need to be stuffed is astronomical, and VoteSleuth is predicting that this is happening in almost every state, systematically. While there could be a mass conspiracy to manipulate millions of votes in the United States, I’m going to go with Occam’s Razor and argue that the law-of-large-numbers approach to election fraud detection just doesn’t hold water.
My impression is that proponents of the model are dead set on proving that election fraud is occurring, without once stopping to consider the ridiculous implications of their model. This is especially notable in light of data directly refuting the notion that this kind of fraud is occurring where their model says it is. Moreover, the interpretation of the model that leads its proponents to claim that Republicans are systematically rigging elections in large precincts could just as easily be explained as Democrats rigging election in small precincts. When your model doesn’t fit the data, you find a new model.
I don’t know what causes larger precincts to swing Republican, and smaller precincts to swing Democrat, but I would bet money it has nothing to do with fraud.