
How Did We Build Book Recommender Systems in an Hour Part 1
Virtually everyone has had an online experience where a website makes personalized recommendations in hopes of future sales or ongoing traffic. Amazon tells you “Customers Who Bought This Item Also Bought”, Udemy tells you “Students Who Viewed This Course Also Viewed”. And Netflix awarded a $1 million prize to a developer team in 2009, for an algorithm that increased the accuracy of the company’s recommendation system by 10 percent.
Building recommender systems today requires specialized expertise in analytics, machine learning and software engineering, and learning new skills and tools is difficult and time-consuming. In this post, we will start from scratch, covering some basic fundamental techniques and implementations in Python. In the future posts, we will cover more sophisticated methods such as content-based filtering and collaborative based filtering.
So, if you want to learn how to build a recommender system from scratch, let’s get started.
Data
Book-Crossings is a book ratings dataset compiled by Cai-Nicolas Ziegler. It contains 1.1 million ratings of 270,000 books by 90,000 users. The ratings are on a scale from 1 to 10.
The data consists of three tables: ratings, books info, and users info. I downloaded these three tables from
import pandas as pdimport numpy as npimport matplotlib.pyplot as plt
books = pd.read_csv('BX-Books.csv', sep=';', error_bad_lines=False, encoding="latin-1")books.columns = ['ISBN', 'bookTitle', 'bookAuthor', 'yearOfPublication', 'publisher', 'imageUrlS', 'imageUrlM', 'imageUrlL']users = pd.read_csv('BX-Users.csv', sep=';', error_bad_lines=False, encoding="latin-1")users.columns = ['userID', 'Location', 'Age']ratings = pd.read_csv('BX-Book-Ratings.csv', sep=';', error_bad_lines=False, encoding="latin-1")ratings.columns = ['userID', 'ISBN', 'bookRating']Ratings data
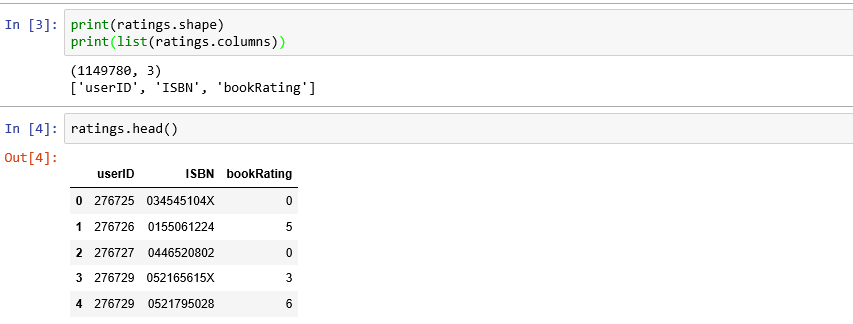
The ratings data set provides a list of ratings that users have given to books. It includes 1,149,780 records and 3 fields: userID, ISBN, and bookRating.

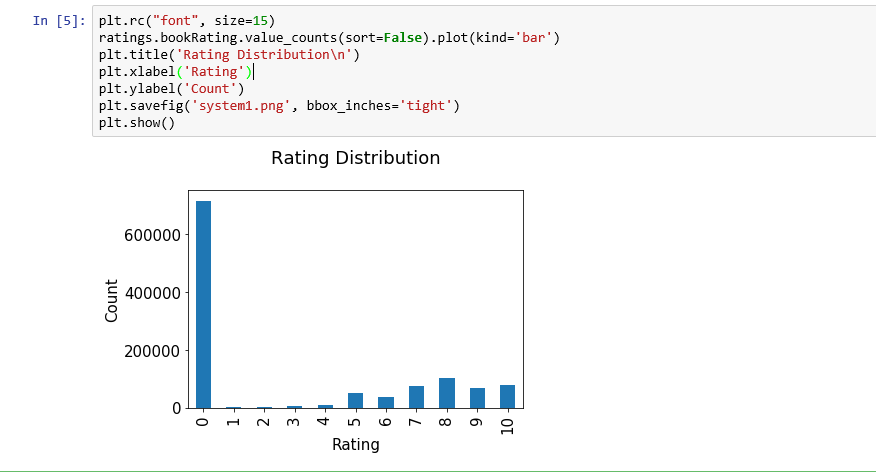
Ratings distribution
The ratings are very unevenly distributed, and the vast majority of ratings are 0.

Books data
The books data set provides book details. It includes 271,360 records and 8 fields: ISBN, book title, book author, publisher and so on.


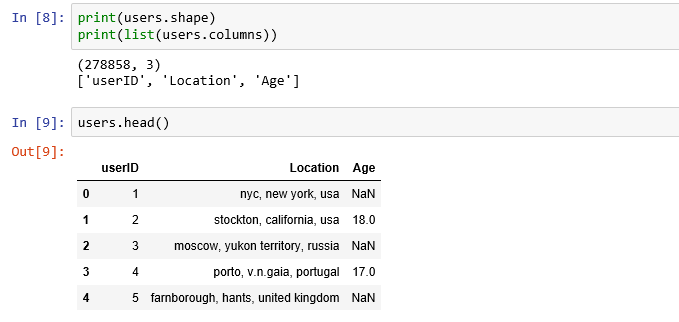
Users data
This dataset provides the user demographic information. It includes 278,858 records and 3 fields: user id, location and age.

Age distribution
The most active users are among those in their 20–30s.


Recommendations based on rating counts

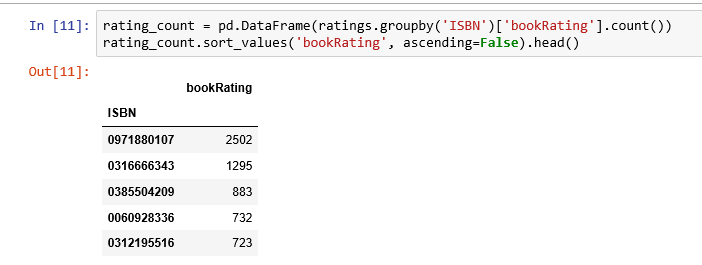
The book with ISBN “0971880107” received the most rating counts. Let’s find out what book it is, and what books are in the top 5.

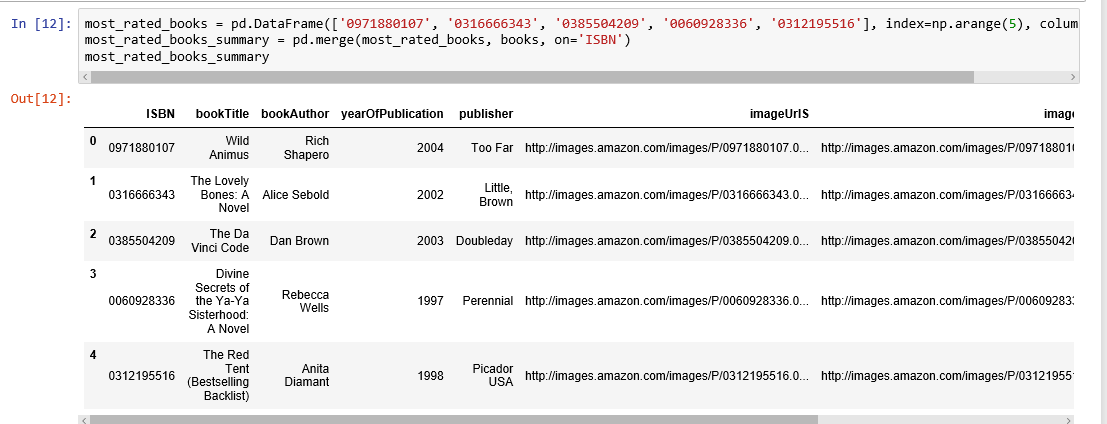
The book that received the most rating counts in this data set is Rich Shapero’s “Wild Animus”. And there is something in common among these five books that received the most rating counts — they are all novels. The recommender suggests that novels are popular and likely receive more ratings. And if someone likes “The Lovely Bones: A Novel”, we should probably also recommend to him(or her) “Wild Animus”.
Recommendations based on correlations
We use Pearsons’R correlation coefficient to measure linear correlation between two variables, in our case, the ratings for two books.
First, we need to find out the average rating, and the number of ratings each book received.


Observations:
In this data set, the book that received the most rating counts was not highly rated at all. As a result, if we were to use recommendations based on rating counts, we would definitely make mistakes here. So, we need to have a better system.
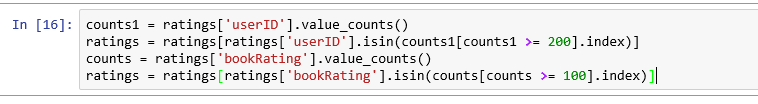
To ensure statistical significance, users with less than 200 ratings, and books with less than 100 ratings are excluded.

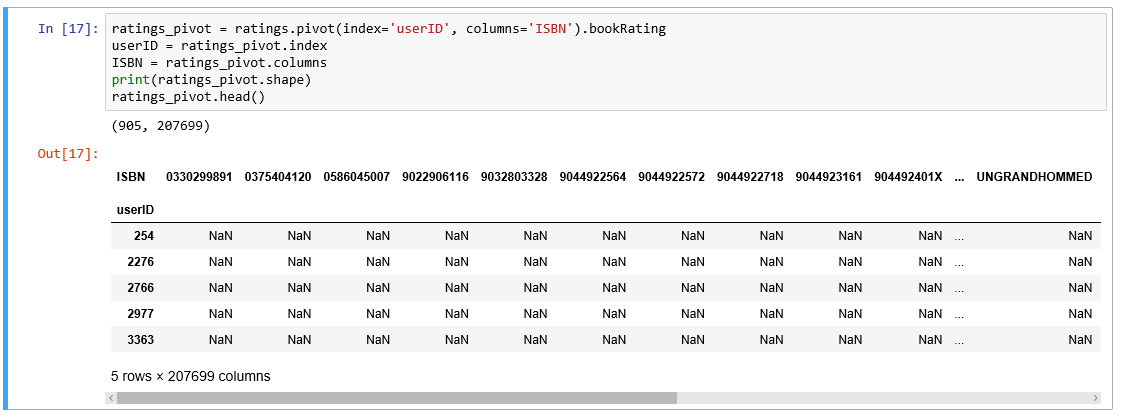
Rating matrix
We convert the ratings table to a 2D matrix. The matrix will be sparse because not every user rated every book.

Let’s find out which books are correlated with the 2nd most rated book “The Lovely Bones: A Novel”.
To quote from the Wikipedia: “It is the story of a teenage girl who, after being raped and murdered, watches from her personal Heaven as her family and friends struggle to move on with their lives while she comes to terms with her own death”.

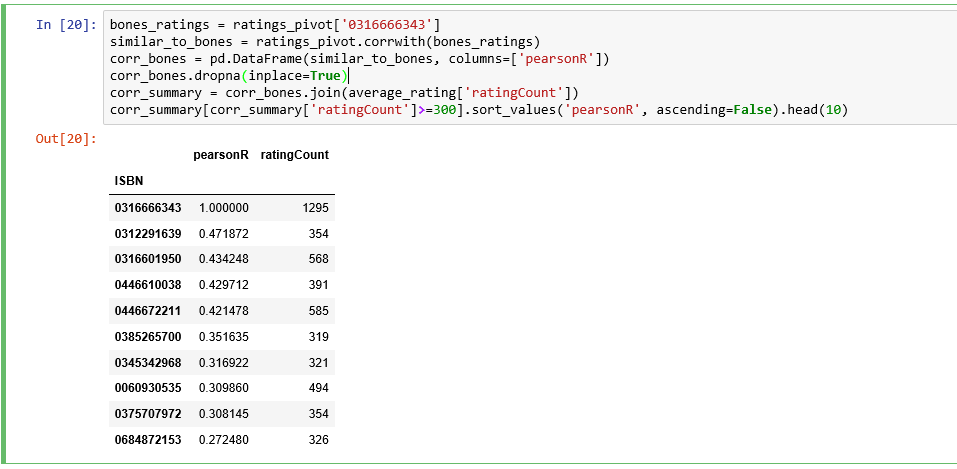
We obtained the books’ ISBNs, but we need to find out the titles of the books to see whether they make sense.


Let’s select three books from the above highly correlated list to examine: “The Nanny Diaries: A Novel”, “The Pilot’s Wife: A Novel” and “Where the Heart is”.
“The Nanny Diaries” satirizes upper class Manhattan society as seen through the eyes of their children’s caregivers.
Written by the same author as “The Lovely Bones”, “The Pilot’s Wife” is the third novel in Shreve’s informal trilogy to be set in a large beach house on the New Hampshire coast that used to be a convent.
“Where the Heart Is” dramatizes in detail the tribulations of lower-income and foster children in the United States.
These three books sound like they would be highly correlated with “The Lovely Bones”. It seems our correlation recommender system is working.
Summary
In this post, we have learned about how to design simple recommender systems that you can implement and test it in an hour. The Jupyter Notebook version for this blog post can be found here. If you want to learn more, Xavier Amatriain’s lecture is a good place to start.
In a future post, we will cover more sophisticated methods such as Content-Based Filtering, k-Nearest Neighbors, Collaborate Filtering as well as how to provide recommendations and how to test the recommender system. Until then, enjoy recommendations!