
Forecasting Exchange Rates Using ARIMA In Python
Forecasting Exchange Rates Using ARIMA In Python
Nearly all sectors use time series data to forecast future time points. Forecasting future can assist analysts and management in making better calculated decisions to maximise returns and minimise risks. I will be demonstrating how we can forecast exchange rates in this article. If you are new to finance and want to understand what exchange rates are then please read my article “
Forecasting Exchange Rates
Recently, a number of technological advancements have been introduced that can forecast future time points quickly, efficiently and accurately. One of them is introduction of statistical and machine learning (ML) models in Python. I provided an overview of basics of python in my article “
In this article, I will use ARIMA model to forecast exchange rates.
In my blog “How do I predict time series?” and “Understanding Auto Regressive Moving Average Model — ARIMA”, I outlined the concept of time series and how ARIMA works. In this blog, I will be using Python programming language with Jupyter notebook to explain how to use ARIMA in python to forecast exchange rates.
Please read FinTechExplained disclaimer.
Using Pandas To Load Exchange Rates Data
Pandas is one of the most popular Python libraries. It is built on type of Numpy python library and offers a range of features including:
Object Creation, Data analysis and data loading. It has inbuilt Statistic functions, can merge/join/union multiple collections. It can also help us in grouping, pivoting and plotting the data. Additionally Pandas is very efficient library to load data from csv, HDF5 and excel. Lastly a range of styling and formatting can be applied to the data.
We will be using pandas to:
1. Load time series exchange rates from a csv (comma separated) file
2. View first 10 records
3. View basic statistical information on the data
Load time series exchange rates from a csv file
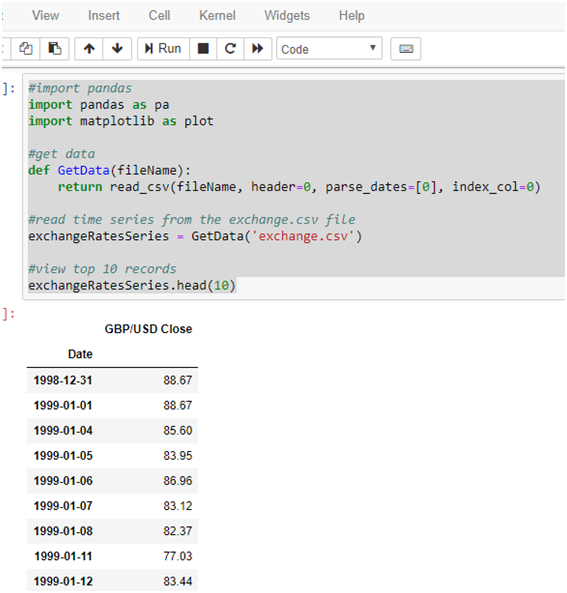
I have prepared a file which includes daily closing GBP/USD exchange rates since 31/12/1998. File is stored here. This file contains data with two columns: Data and GBP/USD Close
Ensure file is saved in the same location as your python notebook.
Type in following lines to load the file and view first 10 records:
To import a library, do: Import <library name> as <alias>
Note: GetData(fileName) is a method that takes in file name as an argument.
Press Alt + Enter to view basic statistical information ont he data
The image below shows the first 10 records of the csv file by calling GetData(fileName) method:

Let’s get useful statistics out and plot the exchange rates
Type in: exchangeRatesSeries.describe() to see the stats as shown below:

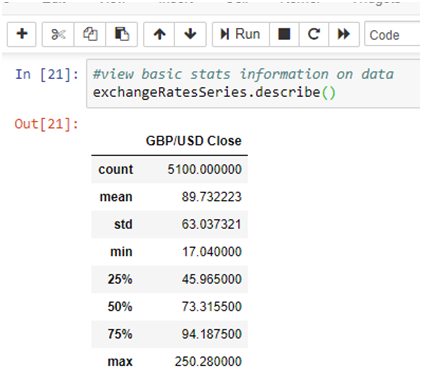
describe() shows a number of useful metrics including:
count — Number of records, mean — expected value, std — Standard deviation telling us dispersion of data around the mean, min — Minimum value in the set, max — Maximum value in the set along with a range of percentiles. Percentiles can help us understand probability distribution of our data.
Plotting the loaded data
Html styling can be added to change feel-and-look in Python. I am setting the plot colour to green:
#plot the time series data
exchangeRatesSeries.plot(color=’green’)

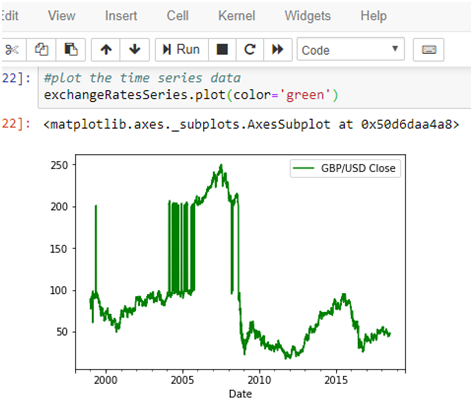
Notice, passing color=’green’ creates a green line graph.
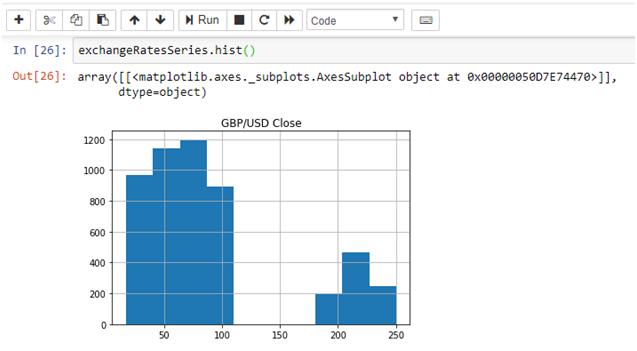
Type in: exchangeRatesSeries.hist() to show historgram.
Histograms can help us understand distribution of data which in return helps us in forecasting a variable:

matplotlib can help us with plotting data. We can also import matplotlib by writing:
from matplotlib import pyplot
Then plot time series by writing:
pyplot.plot(exchangeRateSeries)
ARIMA With StatsModels Package
StatsModels is a powerful python library that is rich with statistical models. StatsModels library contains a number of models which can be used to forecast and predict data. This library holds a number of diagnostic tools too. We are going to use ARIMA model in StatsModels package to forecast exchange rates.
ARIMA Introduction
ARIMA model has 3 parameters:
P — Auto regressive feature of the model
D — Differencing order
Q — Moving average feature of the model
Once we import statsmodels, use the tsa.arima_model and give it an alias of ARIMA:
import statsmodels.tsa.arima_model import ARIMA
ARIMA parameters can be changed to attain different forecasting behaviour. I have defined a user defined method that takes in training set and value for each of the three parameter.The function first creates ARIMA model. It then executes fit() and then forecast() on the model. Forecast() returns a predicted value.
Copy and paste these lines into your notebook:
ARIMA(…) creates ARIMA model. Fits() fits ARIMA(p,d,q) model by exact maximum likelihood via Kalman filter and Forecast() returns an estimated value based on the fitted ARIMA model.
We can think of Fit() as a process that generates best fit line curve that gives least error. More on this topic is covered in my blog: How Good Is My Predicted Model — Regression Analysis?
p, q, d parameters can be tweeked to get better results.
This is an example of how we can pass in time series data and use ARIMA to predict a value based on the actual observed data:
By running the script, we see the predicted value:

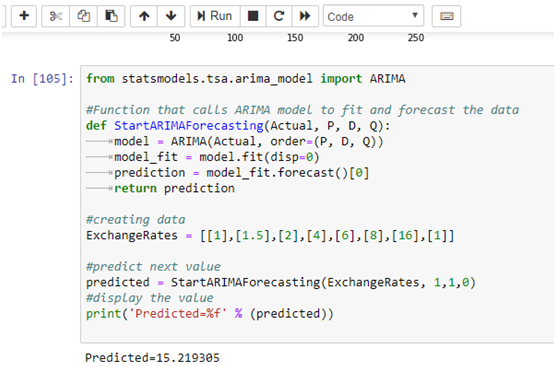
We passed in random values as training set. ARIMA model then fitted itself and predicted the next value as 15.219305
We can also pass in exogenous variables, dates, frequency of time series etc to the ARIMA model.


Lastly, Let’s Use ARIMA In Python To Forecast Exchange Rates
Now that we understand how to install Python, how we can create variables and loops, use python Pandas to load csv data and how to use StatsModels to predict value, let’s combine all of the knowledge acquired in this blog to forecast our sample exchange rates.
Copy and paste this code. It is a combination of all of the concepts which we have learnt in this blog.
Press Alt+Enter. Python will start calling ARIMA model in a loop with the actual data. 70% of data is used to train the model and the rest 30% is used to test the accuracy. Each time a newly predicted value is produced.
Actual and predicted values will be printed on the notebook.
Finally actual vs predicted values will be plotted on the chart
View Mean Squared Error
I have also imported an additional library sklearn which I will be using in my future blogs.
Copy paste this line:
“from sklearn.metrics import mean_squared_error” to import the library.
Finally print Mean Squared Error:
Mean squared error calculates an average of the difference between actual and predicted data and tells you how good your model is. More information can be found in my blog: How Good Is My Predictive Model — Regression Analysis
By running the code below, we can view the actual, forecasted values along with a line graph and total mean squared error:

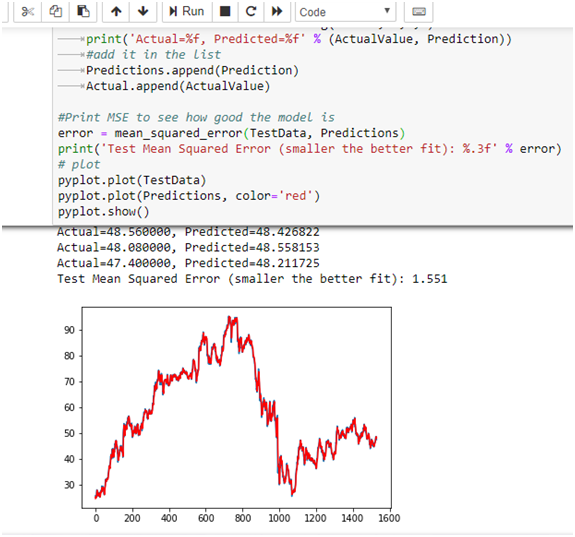
As you can see, we printed actual and predicted values. Additionally, we plotted predicted values in red with MSE of 1.551.
For complete notebook, please visit here.
Summary
This article demostrated how to use python to forecast exchange rates using ARIMA model.
Please let me know if you have any feedback.