
The Optimal Post is 7 Minutes
Bucketing seconds per visitor
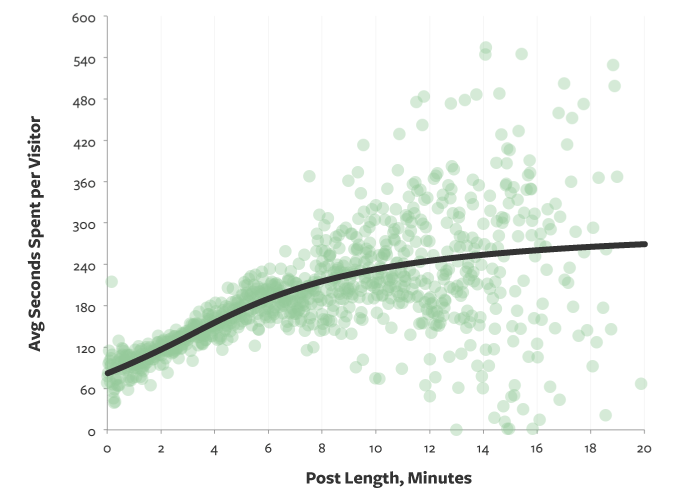
To shape the data into a more readable form, we’ll bucket the posts and take averages. Specifically, we’ll group the posts by each 1-second bar in the histogram and calculate the average seconds-per-visitor:


We now see an explicit upward trend for shorter posts. Since we know from the prior chart that the trend continues to slope upward for longer posts, we’re more confident with the overall pattern:

Calculating medians
When we examined the underlying data, we often noticed outlier visitors who spent exceptionally long amounts of time reading a post. We already remove the time from idle browser tabs, but there are still outliers totaling several hours (sometimes spanning multiple visits). They raise the average enough to cause overestimates.
So, a better measure in this case is the median, not average, of time spent per visitor:


The general pattern is similar, but we see a dip for longer posts:


Even with this dip, a larger percent of the longer posts tend to have high values. So while the median time spent decreases, longer posts are also more likely to be one of the hits that perform especially well.