Effortless network response logging on Android
Effortless network response logging on Android
If you’ve ever developed an Android app, chances are that your app has loaded some data from a remote server. While developing your app, you often need to see what data you’re actually getting from the server your app is connected to.
If you’ve made an Android app in the last few years, you have probably used (or at least stumbled upon)
So, what options do you have to inspect network responses when using Retrofit?
Retrofit / OkHttp’s logging
Retrofit and OkHttp have some built-in methods to log HTTP responses. The way you enable them depends on the version of Retrofit you use.
Retrofit 1.x
On the older Retrofit 1.x, you could enable response logging when creating the RestAdapter by simply setting a property directly on its builder:
LogLevel logLevel = LogLevel.FULL;
new RestAdapter.Builder()
        .setClient(client)
        .setEndpoint(endpoint)
        .setConverter(converter)
        .setErrorHandler(errorHandler)
        .setLogLevel(logLevel)
        .build();
LogLevel is an enum that specifies the detail of logging. Its value can be one of: NONE, BASIC, HEADERS, HEADERS_AND_ARGS or FULL, depending on how much info you would like it to print out to logcat on every network call.
Retrofit 2.x
A stable version of Retrofit 2.0 has been released in the first half of March ‘16, with a lot of changes. I suggest you upgrade it, if you haven’t already:
Once you’ve upgraded, you’ll notice there have been some changes related to logging. Specifically, it’s no longer possible to set the log level on the (now renamed) Retrofit.Builder class directly.
Retrofit 2.x relies directly on another Square’s library, OkHttp3 to make the actual network calls over HTTP. This has changed from the previous version of Retrofit (1.x) which did not depend on OkHttp directly, consequently you were able to use different HTTP clients, as long as they implemented Retrofit’s Client interface.
As a consequence, the logging has now moved from Retrofit to OkHttp.
You can now achieve similar logging as with Retrofit 1.x by using an interceptor for OkHttp, called HttpLoggingInterceptor.
To use it, you must first include it in Gradle, since it’s distributed as a separate dependency:
compile 'com.squareup.okhttp3:logging-interceptor:<latest>'
Then add the logging interceptor to OkHttp as you would normally:
Level logLevel = Level.BODY;
HttpLoggingInterceptor interceptor = new HttpLoggingInterceptor();
interceptor.setLevel(logLevel);
new OkHttpClient.Builder()
        .addInterceptor(interceptor)
        .build();
How does the log output look like?
The network response body is logged to Android’s logcat in plain text. This is usually split over multiple lines and is often quite hard to read:


Usually you then have to copy all the response lines from logcat and strip the timestamp, package name and tag at the beginning of each line. Once you have the plain JSON response, you can use a service like JsonFormatter or an Online JSON Viewer into which you paste the plain JSON in order to make it more readable.
For me, going through that whole procedure every time I wanted to examine a network response became a tedious and time consuming task very quickly. That’s why I decided to create my own interceptor that would simplify the process.
OkLog — a quicker way to examine responses
OkLog is a network response logging interceptor for OkHttp that simplifies the task of debugging network responses during development.
There are two separate libraries, depending on which version of OkHttp you use: OkLog → for OkHttp and OkLog3 → for OkHttp3.
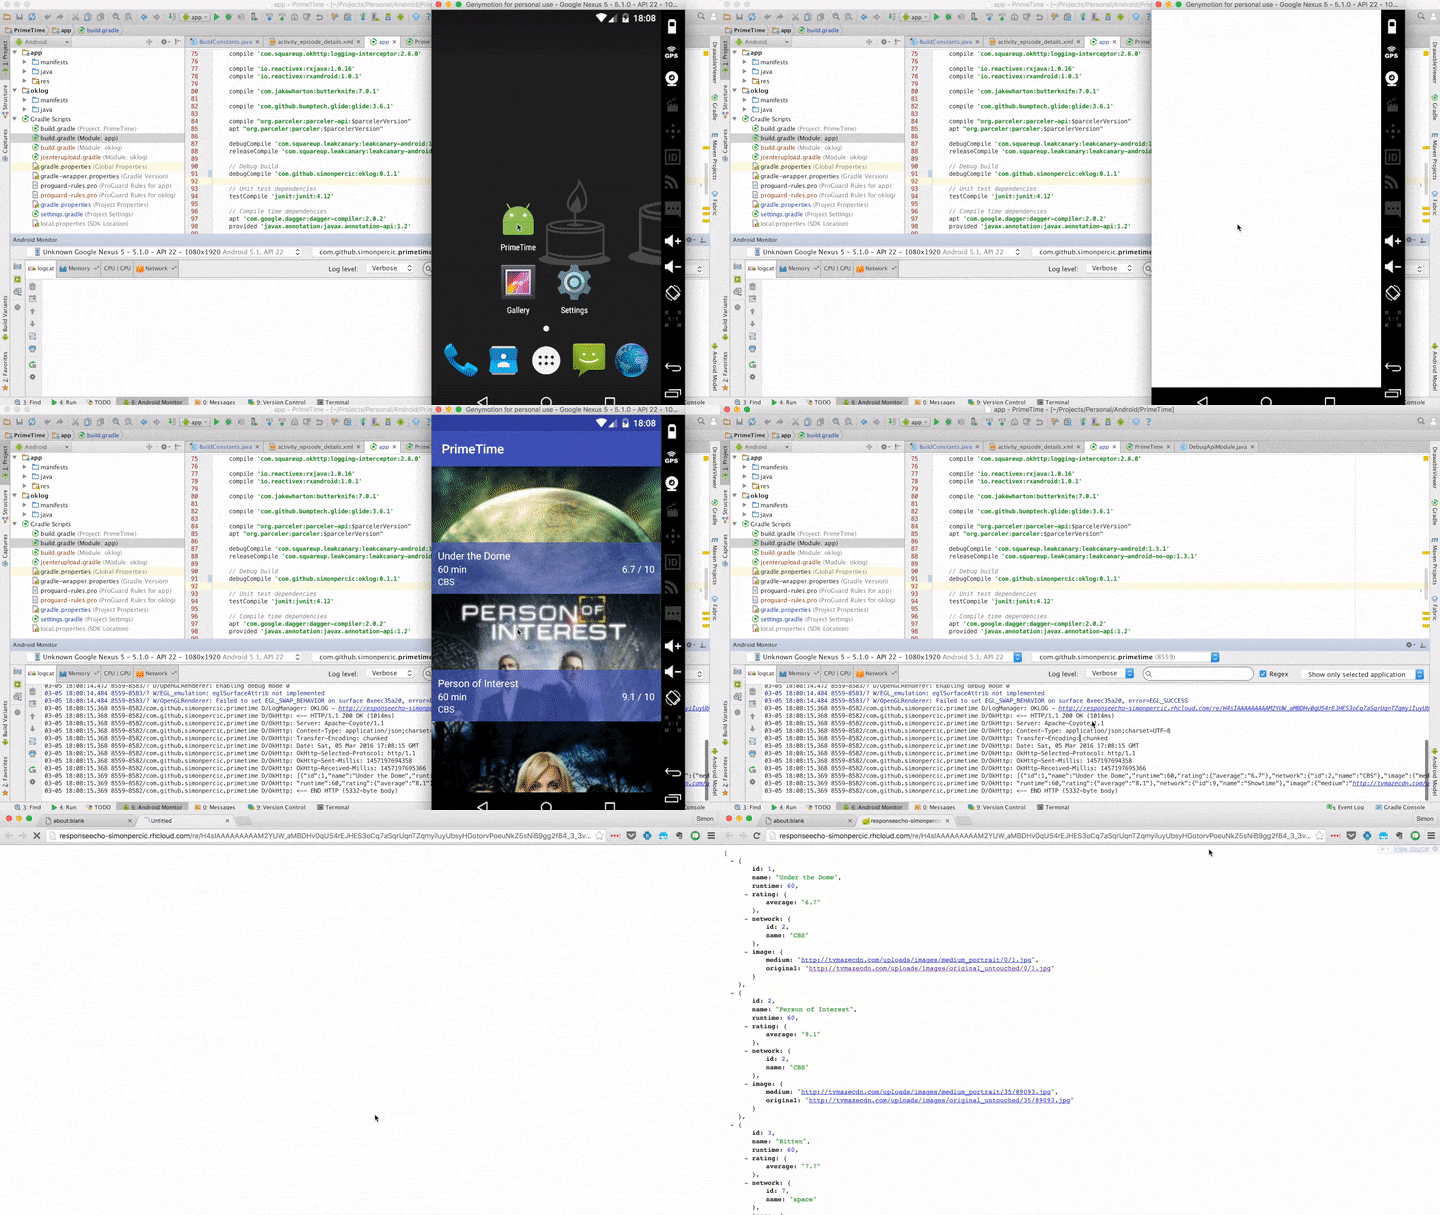
OkLog writes a clickable URL to logcat with network response as a part of the URL’s path.
That way, you are able to simply click on a link in Android Studio’s log display and you’re presented with the plain response in your browser:


Another benefit is being able to share these URLs with other developers (usually REST API developers).
How does it work?
OkLog intercepts the plain network response from OkHttp by implementing its own “application” interceptor.
After it has the plain response, it then transforms that string to a more url-friendly format and generates an URL which includes the transformed response as a part of the path.
That URL is then logged. OkLog has an optional dependency to Timber, which will be used only if it’s present in your app’s dependencies at runtime. If not, it will fallback to Android’s built-in Log methods to do the logging (you can also force it to use the built-in methods, if that’s what you prefer). You can even set a custom LogInterceptor to do your own logging if you so desire.
So, how exactly is the response transformed?
The plain response is first gzipped in order to make the string as short as possible. After that, the resulting string is Base64-encoded to make it url-friendly.
What happens when the URL is clicked?
By default, the generated URL points to a hosted instance of a complementary Spring web app, called ResponseEcho. That app takes the string parameter from the URL-path and does the exact opposite from OkLog, i.e. Base64 decodes and un-gzips the parameter and returns it as a plain response.
If that plain response happens to be a JSON, the web app will pretty-print the JSON before returning it for easier reading.
If you wish, you can also self-host the web-app and set OkLog to prefix the urls with your own hostname.
How to use it?
A complete usage example is included in the Readme on GitHub, here is an excerpt:
- first include the correct OkLog version, i.e.
// pre-OkHttp3
compile 'com.github.simonpercic:oklog:<latest>'
// OkHttp3
compile 'com.github.simonpercic:oklog3:<latest>'
- create an instance of OkLogInterceptor using a builder()
OkLogInterceptor interceptor = OkLogInterceptor.builder()
        // set desired custom options
        .build();
- add an instance of OkLogInterceptor to OkHttp’s interceptors
// for pre-OkHttp3
List<Interceptor> clientInterceptors = okHttpClient.interceptors();
Collections.addAll(clientInterceptors, okLogInterceptor);
// for OkHttp3
new OkHttpClient.Builder().addInterceptor(okLogInterceptor).build();
- create a Retrofit/2 instance with that OkHttpClient instance, as you would normally
Known limitations
OkLog writes logs to Android’s logging system, which has a limited line length (~4000 chars).
Even though the generated URLs are gzipped and Base64 encoded, they might still be longer than the log line limit on very large network responses.
Unfortunately, there is no workaround with the current system. Nevertheless, everything should work fine for the majority of cases.
OkLog optionally uses Timber for the actual logging, which splits lines that are too long, so you can see if a response was longer than the limit. If it was split into multiple lines, you can concatenate all the lines manually to get the valid URL.
Another approach - Facebook’s Stetho
Facebook’s Stetho takes a different approach to network response debugging than the approaches mentioned above.
Instead of logging the response to logcat, Stetho has an optional dependency that supports OkHttp/3 network interceptors.
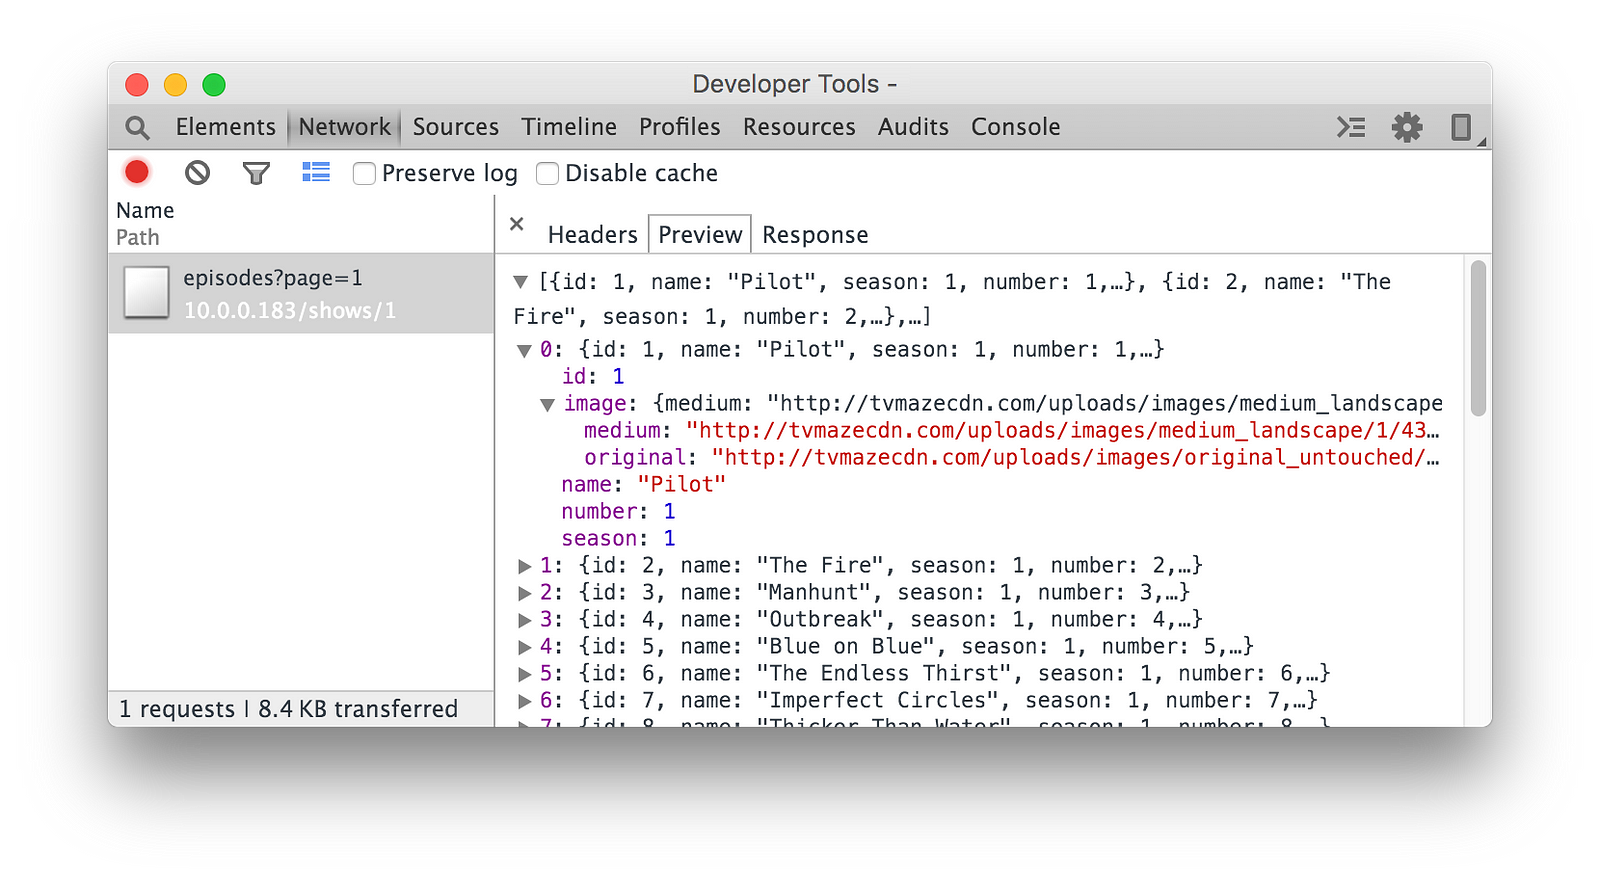
That way, Stetho enables you to debug network responses through Chrome Developer Tools:


Chrome Developer Tools is a great tool that allows you to see a lot of info about network activity.
However, it may be too cumbersome if you only wish to see a network response in a quick way. Besides that, there is no quick and easy way to share that response with someone else besides copying everything, going through a service to make the response more readable and pasting the entire thing somewhere online / sending over Slack, etc.
Which one should you use?
I feel there is no silver bullet that would cover all cases, instead I believe different solutions should be used side-by-side, each of them handling its own use case.
In my projects, I use OkHttp’s HttpLoggingInterceptor to quickly see basic info about the request directly in logcat. Complementary, I use OkLog to quickly see the plain response in the browser and optionally share it with a coworker.
