matplotlib之餅狀圖
阿新 • • 發佈:2018-12-30
import matplotlib.pyplot as plt


labels = 'A', 'B', 'C', 'D'
fracs = [35, 20, 45, 10]

plt.pie(x=fracs, labels=labels)
plt.show()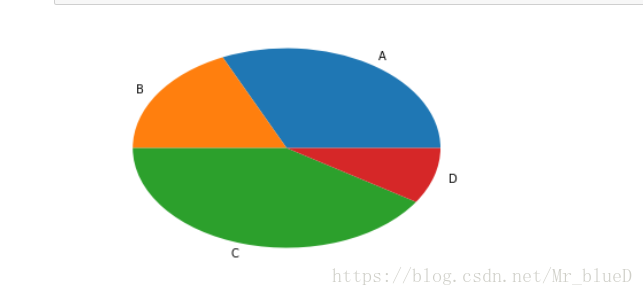
圓形餅圖
import matplotlib.pyplot as plt


labels = 'A', 'B', 'C', 'D'
fracs = [35, 20, 45, 10]

plt.axes(aspect=1)
plt.pie(x=fracs, labels=labels)
plt.show()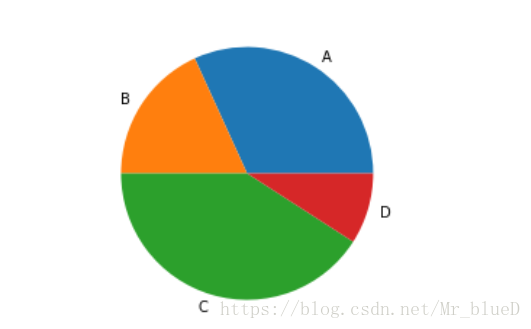
比例顯示
import matplotlib.pyplot as plt


labels = 'A', 'B', 'C', 'D'
fracs = [35, 20, 45, 10]

plt.axes(aspect=1)
plt.pie(x=fracs, labels=labels, autopct='%.0f%%')
plt.show()

突出顯示
import matplotlib.pyplot as plt


labels = 'A', 'B', 'C', 'D'
fracs = [35, 20, 45, 10]
explode = [0, 0.05, 0.08, 0]

plt.axes(aspect=1)
plt.pie(x=fracs, labels=labels, autopct='%.0f%%', explode=explode)
plt.show()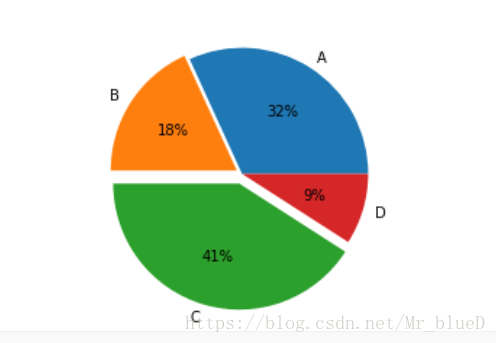
新增陰影
import matplotlib.pyplot as plt


labels = 'A', 'B', 'C', 'D'
fracs = [35, 20, 45, 10]
explode = [0, 0.05, 0.08, 0]

plt.axes(aspect=1)
plt.pie(x=fracs, labels=labels, autopct='%.0f%%', explode=explode, shadow=True)
plt.show()