1. 程式人生 > >Python應用matplotlib繪圖簡介

Python應用matplotlib繪圖簡介

現在通過numpy和matplotlib在Python上實現科學計算和繪圖,而且和matlab極為想象(效率差點,關鍵是方便簡單)

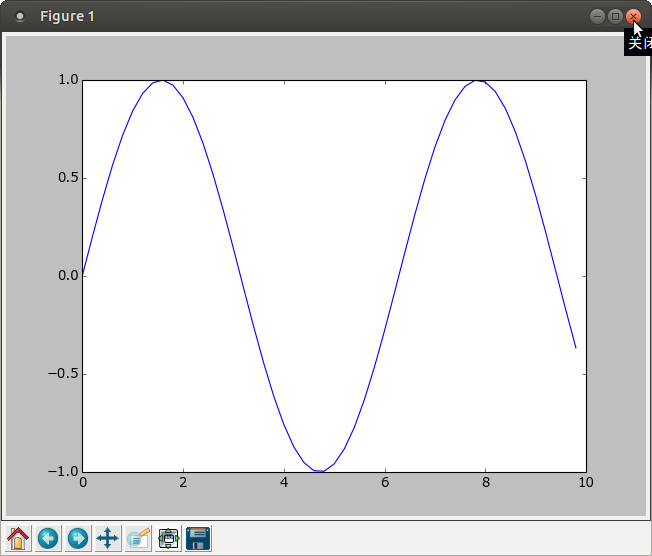
1. 最簡單的繪圖例項

import matplotlib.pyplot as plt
import numpy as np

x = np.arange(0, 10, 0.2)
y = np.sin(x)

plt.plot(x, y)
plt.show()

這裡寫圖片描述

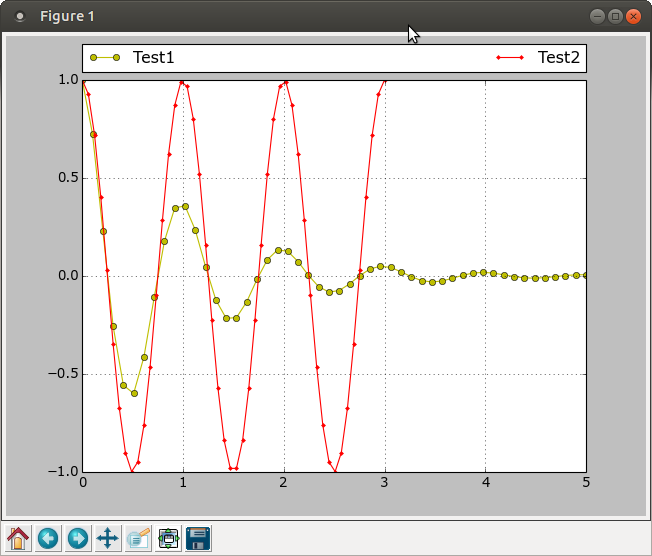
2. 一個複雜的例子

import numpy as np
import matplotlib.pyplot as plt
from matplotlib.figure import Figure

x1 = np.linspace(0.0
, 5.0) x2 = np.linspace(0.0, 3.0) y1 = np.cos(2 * np.pi * x1) * np.exp(-x1) y2 = np.cos(2 * np.pi * x2) figure, ax1 = plt.subplots(1,1) # plt.subplots_adjust(left=0.14, bottom=0.1) # ax1 = figure.add_axes([0.14, 0.35, 0.77, 0.6 ]) ax1.grid(True) ax1.plot(x1, y1, 'yo-', label="Test1") ax1.plot(x2, y2, 'r.-', label='Test2'
) plt.legend(bbox_to_anchor=(0., 1.02, 1., .102), loc=3, ncol=2, mode="expand", borderaxespad=0.) plt.show()

這裡寫圖片描述

3. 其它