Python:使用matplotlib繪製圖表
阿新 • • 發佈:2019-01-02
今天看了一下使用python繪製圖表的方法,有個強大的類庫matplotlib,可以製作出高質量的2D和3D圖形,先記錄一下,以後慢慢學習。
幾個繪圖的例子,來自API手冊:
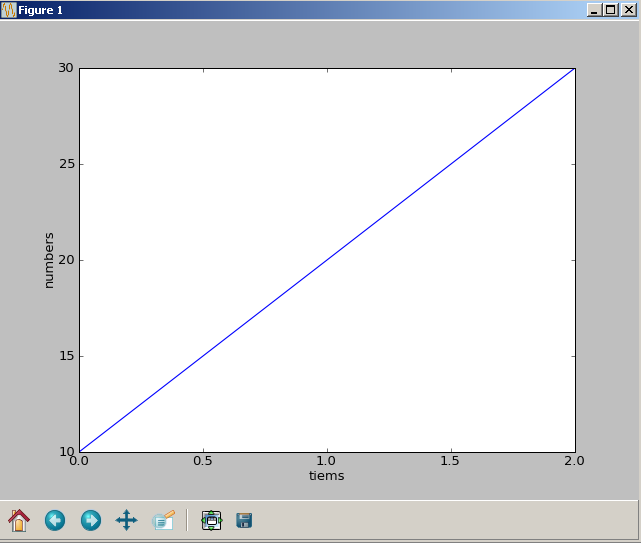
1、最簡單的圖:
程式碼:
#!/usr/bin/env python
import matplotlib.pyplot as plt

plt.plot([10, 20, 30])
plt.xlabel('tiems')
plt.ylabel('numbers')
plt.show()
測試:
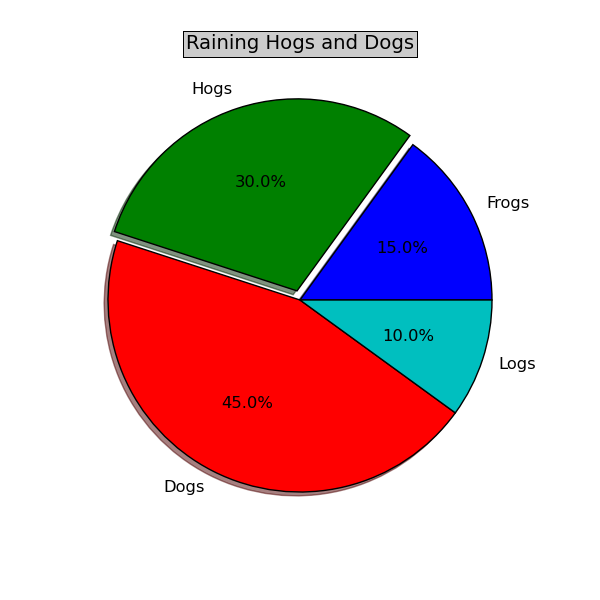
2.餅圖:
程式碼:
#!/usr/bin/env python
# -*- coding: utf-8 -*-

from pylab import *

# make a square figure and axes
figure(1, figsize=(6,6))
ax = axes([0.1, 0.1, 0.8, 0.8])

labels = 'Frogs', 'Hogs', 'Dogs', 'Logs'
fracs = [15,30,45, 10]

explode=(0, 0.05, 0, 0)
pie(fracs, explode=explode, labels=labels, autopct='%1.1f%%', shadow=True)
title('Raining Hogs and Dogs', bbox={'facecolor':'0.8', 'pad':5})
savefig('D:\\pie.png')
show()
測試:
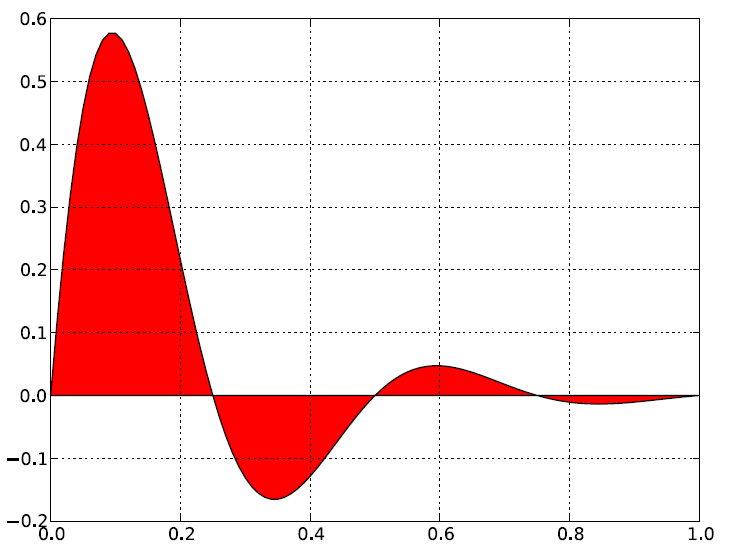
3、使用numpy庫函式:
程式碼:
#!/usr/bin/env python
# -*- coding: utf-8 -*-

import numpy as np
import matplotlib.pyplot as plt

t = np.arange(0.0, 1.01, 0.01)
s = np.sin(2*2*np.pi*t)

plt.fill(t, s*np.exp(-5*t), 'r')
plt.grid(True)

#儲存為PDF格式,也可儲存為PNG等圖形格式
plt.savefig('D:\\test.pdf')
plt.show()
測試: