python-pandas繪圖
阿新 • • 發佈:2019-01-03
pandas繪圖顯示 : plt.show()
儲存到本地 : plt.savefig(‘image.png’)
%matplotlib inlineimport pandas as pd
import matplotlib.pyplot as pltpresent = pd.read_table('data.txt', sep=' ')present.shapepresent.columnspresent_year = present.set_index('year' present_year['boys'].plot()
plt.legend(loc='best')present_year.plot() #has index,columnpresent_year.girls.plot(color='g' present_year[:10].plot(kind='bar')present_year[:10 present_year[:10].plot(kind='bar', stacked=True)present_year.sum(1)[:5]present_year.div(present_year.sum(1),axis=0)[:10].plot(kind='barh', stacked=True)present_year.plot(x='boys', y='girls', kind='scatter')iris = pd.read_csv('iris.csv')
iris.head(5)| SepalLength | SepalWidth | PetalLength | PetalWidth | Name | |
|---|---|---|---|---|---|
| 0 | 5.1 | 3.5 | 1.4 | 0.2 | Iris-setosa |
| 1 | 4.9 | 3.0 | 1.4 | 0.2 | Iris-setosa |
| 2 | 4.7 | 3.2 | 1.3 | 0.2 | Iris-setosa |
| 3 | 4.6 | 3.1 | 1.5 | 0.2 | Iris-setosa |
| 4 | 5.0 | 3.6 | 1.4 | 0.2 | Iris-setosa |
iris.corr()| SepalLength | SepalWidth | PetalLength | PetalWidth | |
|---|---|---|---|---|
| SepalLength | 1.000000 | -0.109369 | 0.871754 | 0.817954 |
| SepalWidth | -0.109369 | 1.000000 | -0.420516 | -0.356544 |
| PetalLength | 0.871754 | -0.420516 | 1.000000 | 0.962757 |
| PetalWidth | 0.817954 | -0.356544 | 0.962757 | 1.000000 |
from pandas.tools.plotting import scatter_matrix
scatter_matrix(iris, alpha=0.2, figsize=(6, 6), diagonal='kde')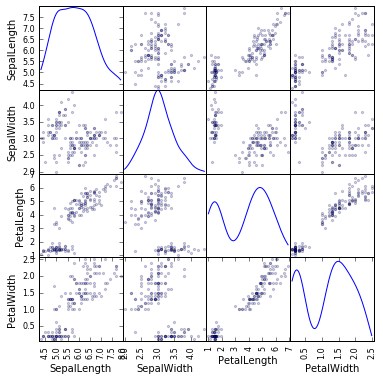
箱圖
DataFrame提供了boxplot方法可以用來畫箱圖。
iris.boxplot()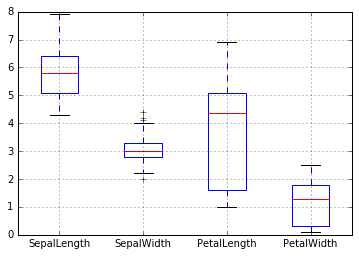
iris.boxplot(by='Name', figsize=(8, 8))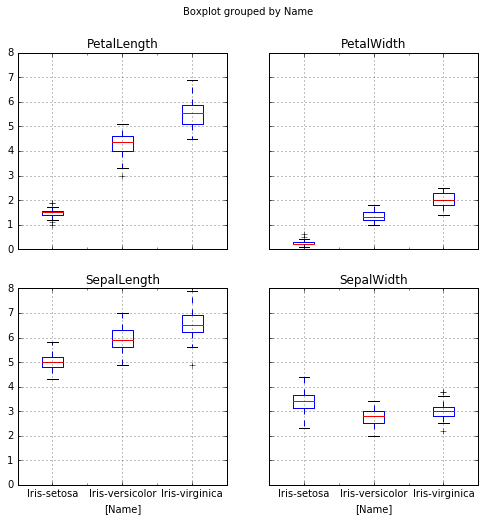
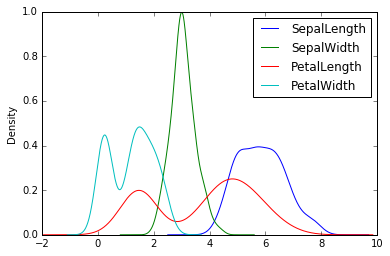
直方圖和概率密度分佈
iris.ix[:,:-1].hist()
iris.plot(kind='kde')
多變數的視覺化
Radviz
from pandas.tools.plotting import radviz
radviz(iris, 'Name')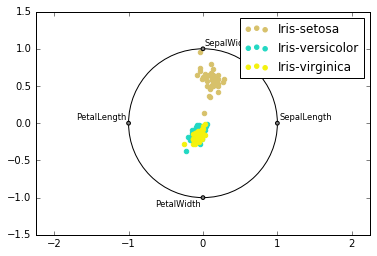
from pandas.tools.plotting import andrews_curves
andrews_curves(iris, 'Name')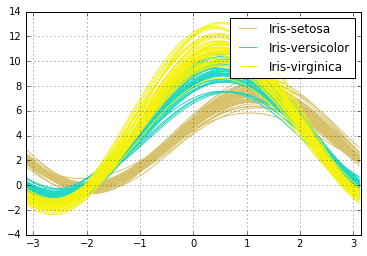
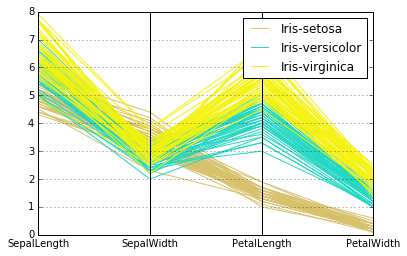
Parallel Coordinates
from pandas.tools.plotting import parallel_coordinates
parallel_coordinates(iris, 'Name')